Looking in from the outside, trading may sometimes feel like it’s done on gut feeling or some divination. But in reality, trading is all about gathering and interpreting knowledge. One of the best sources of such structured trading knowledge are the trading indicators.
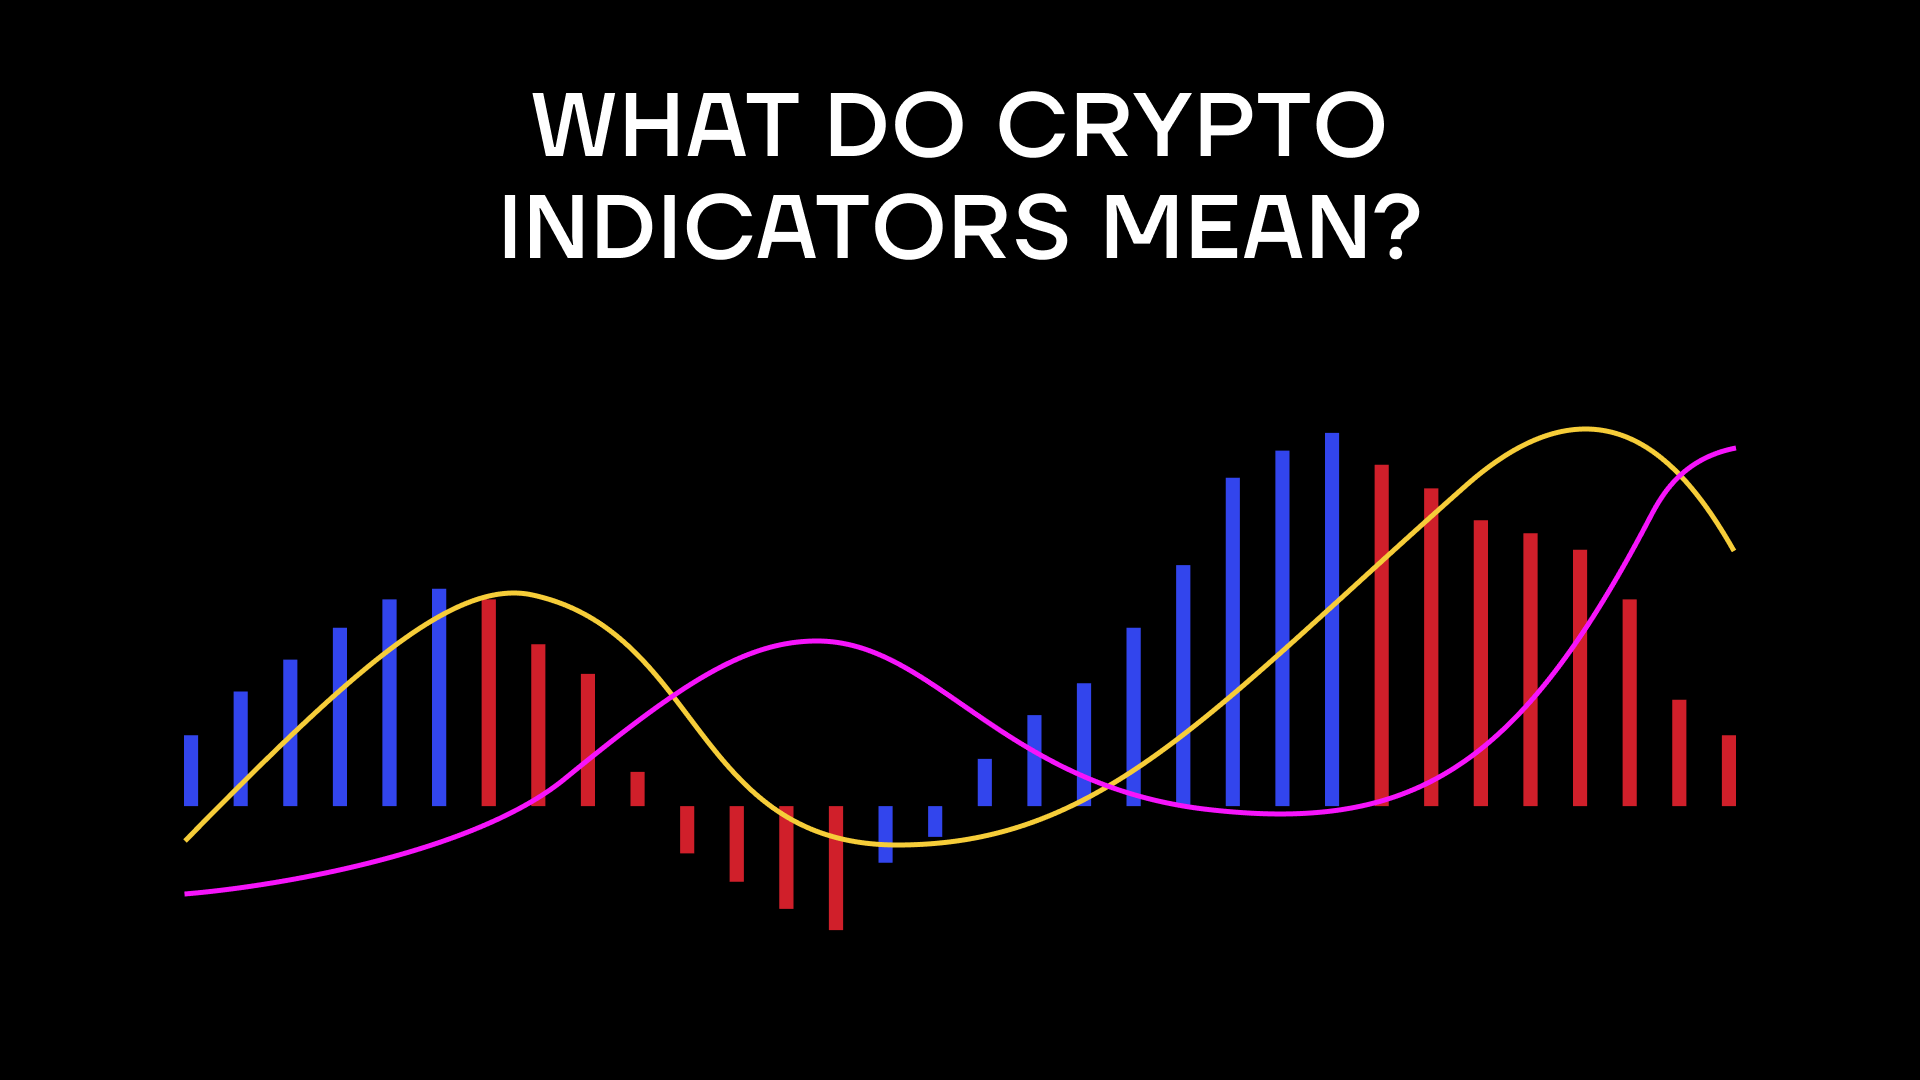
What do Crypto Indicators Mean?
According to IG.com:
- Trading indicators are mathematical calculations, which are plotted as lines on a price chart and can help traders identify certain signals and trends within the market.
- There are different types of trading indicator, including leading indicators and lagging indicators. A leading indicator is a forecast signal that predicts future price movements, while a lagging indicator looks at past trends and indicates momentum.
What does it all mean for finding best crypto trading indicators? Basically, that there is a lot of market data that is very hard for a human to process. Visualizing it helps traders understand and maybe even predict price trends to make more informed trades. Which indicator is best for crypto trading? Remember: the best crypto indicator is likely to be the same as the best indicator for most other assets, since price movements are nearly universal.
Some Easy Indicators Beginner Crypto Traders Should Use
There are hundreds, if not thousands of crypto indicators, with few traders even knowing all of them, let alone using them to trade daily. Some are very advanced and some work better in combination with each other. However, a beginner trade would be more comfortable starting with the more basic trading indicators and working their way up to more advanced ones only once the basic crypto indicators have been mastered, eventually deciding on the best crypto indicators for themselves.
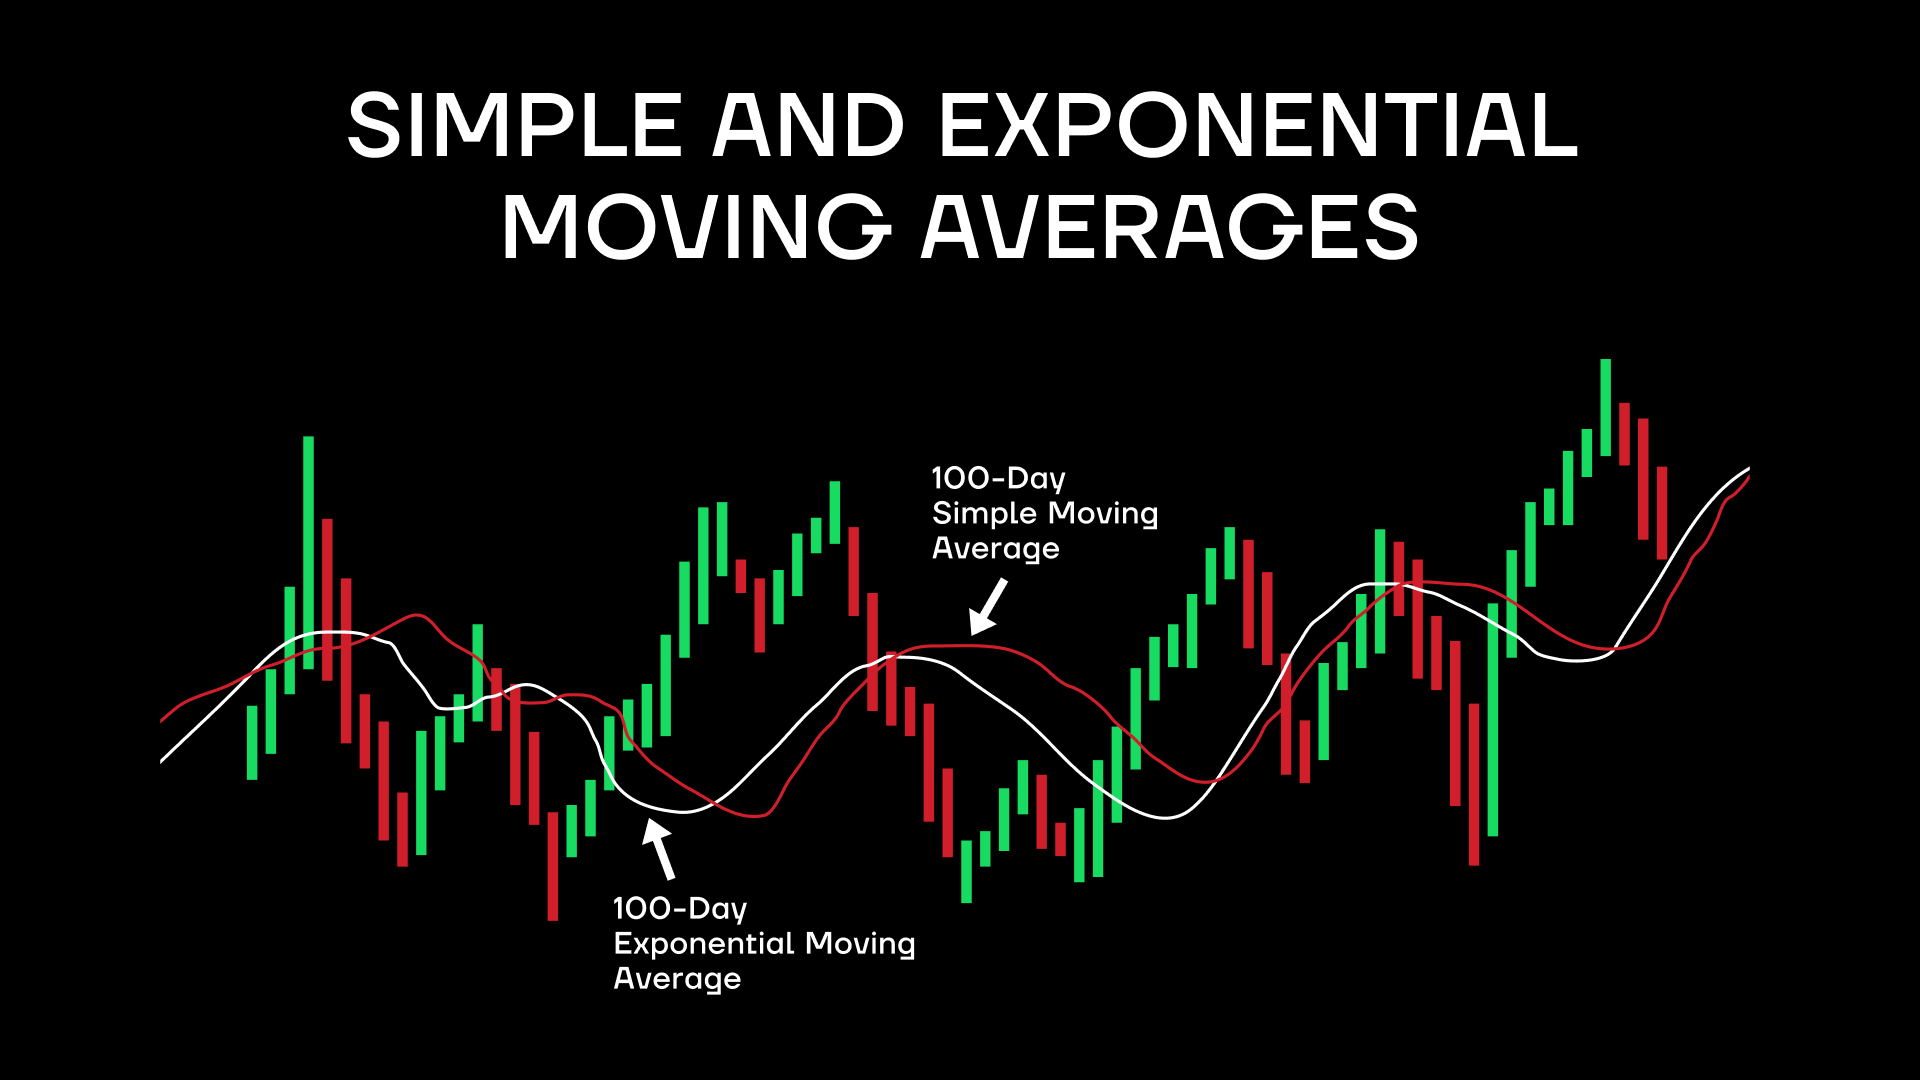
Simple and exponential moving averages
You see a price chart. The price goes up one day/hour/minut, down the other, back again. Which way is it trending? Visually, the answer depends on what time window you’re looking at. Technically, a crypto indicator can plot a moving average using mathematical calculations to tell you where the price is moving in a more accurate way. To do that, it basically ignores short term spikes that can confuse you visually into believing that the price could be headed sky high or fall to the bottom. Instead, the moving average (especially the Simple Moving Average, SMA) shows you where the overall price trend is heading.
But what if the price movement is not uniform? What if it’s been trending higher/lower recently and the SMA is not catching that? This is why you have the EMA (Exponential Moving Average), which places more weight on more recent price trends and can help you spot a significant change in the price movement. The way it’s calculated, the EMA can also help measure how real the perceived change in price movement is. For a simple tool, it’s quite powerful.
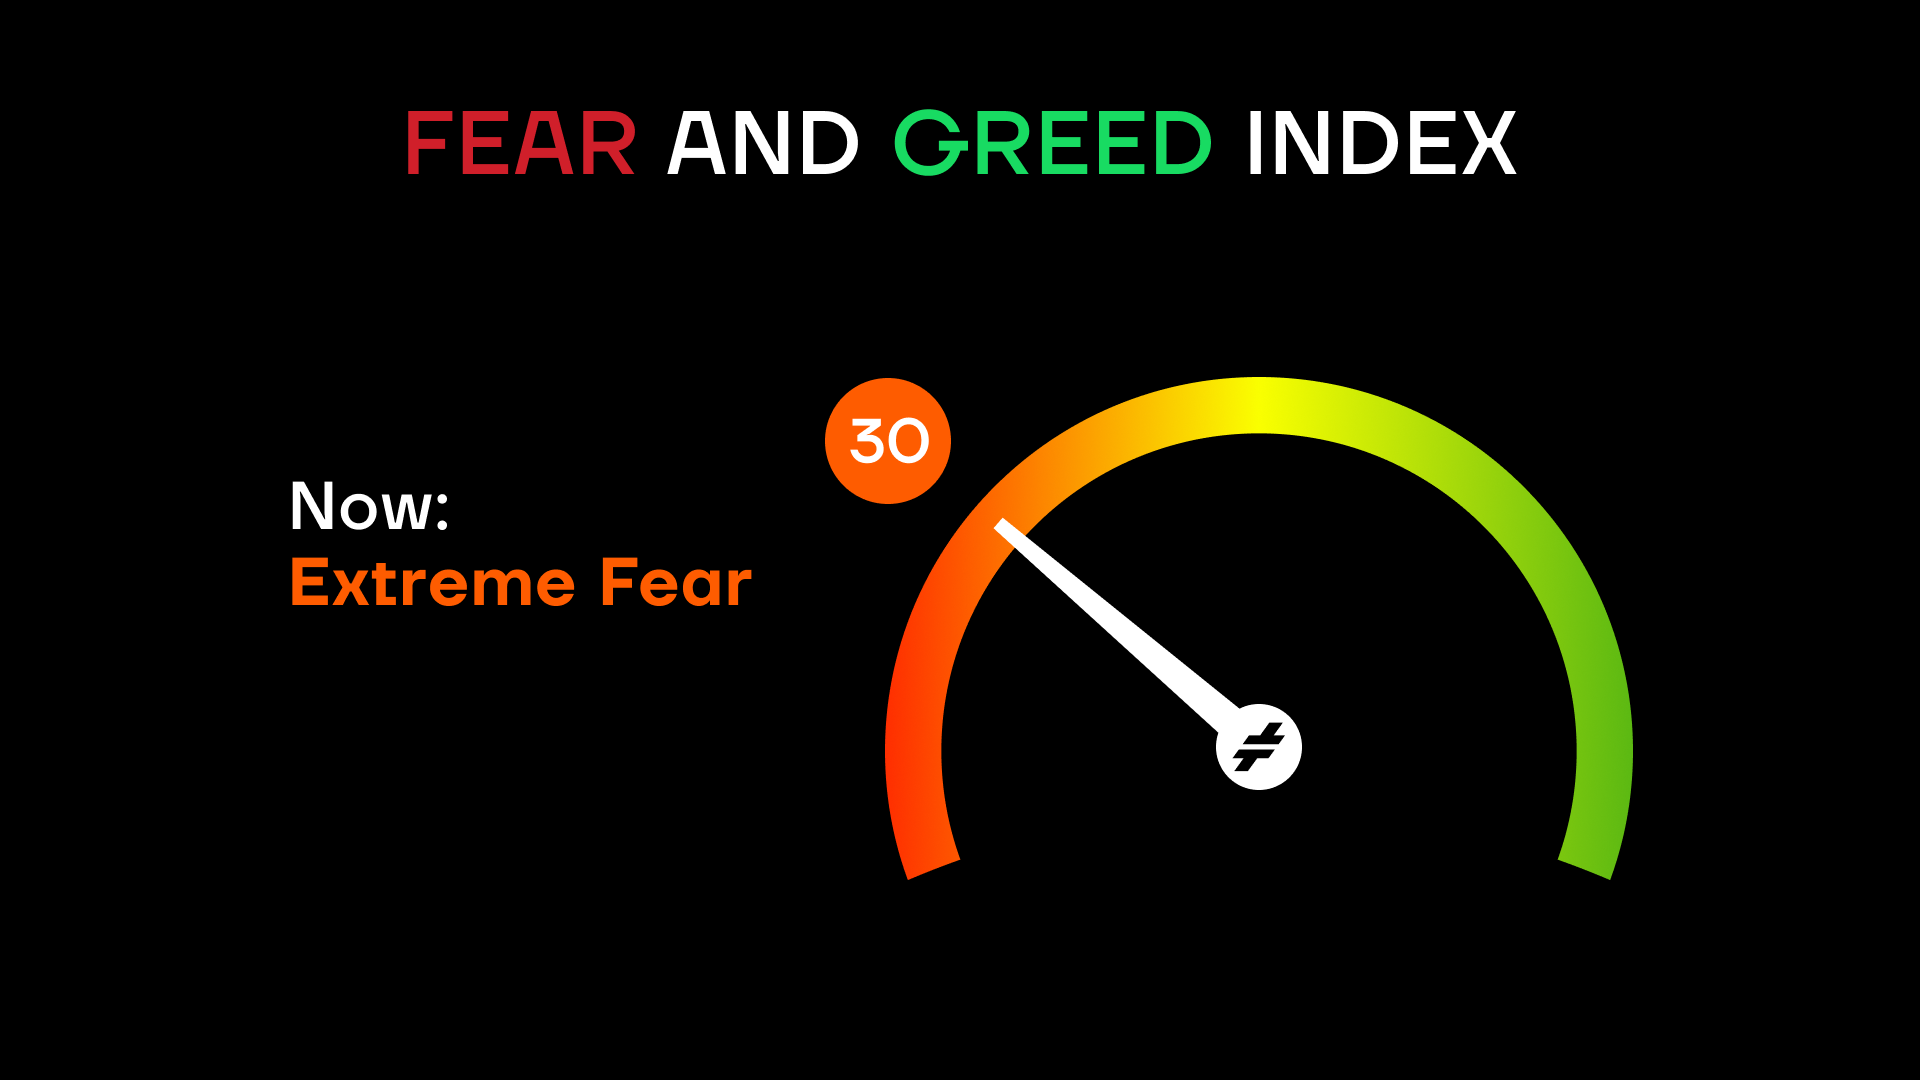
Fear and Greed Index
Sometimes, the best crypto trading indicator is the simplest one. Obviously, no one can directly measure fear and greed of even one person, let alone of an entire market. But there are ways to measure it by proxy. The most popular method is called the Fear and Greed Index. According to CNN Business:
- The Fear & Greed Index is a compilation of seven different indicators that measure some aspect of stock market behavior. They are market momentum, stock price strength, stock price breadth, put and call options, junk bond demand, market volatility, and safe haven demand.
Taken together, these measures can give a good idea of what’s going on in the stock market less in terms of the underlying numbers such as company earnings but more so whether people react to market news with more excitement and optimism (greed) or caution and pessimism (fear).
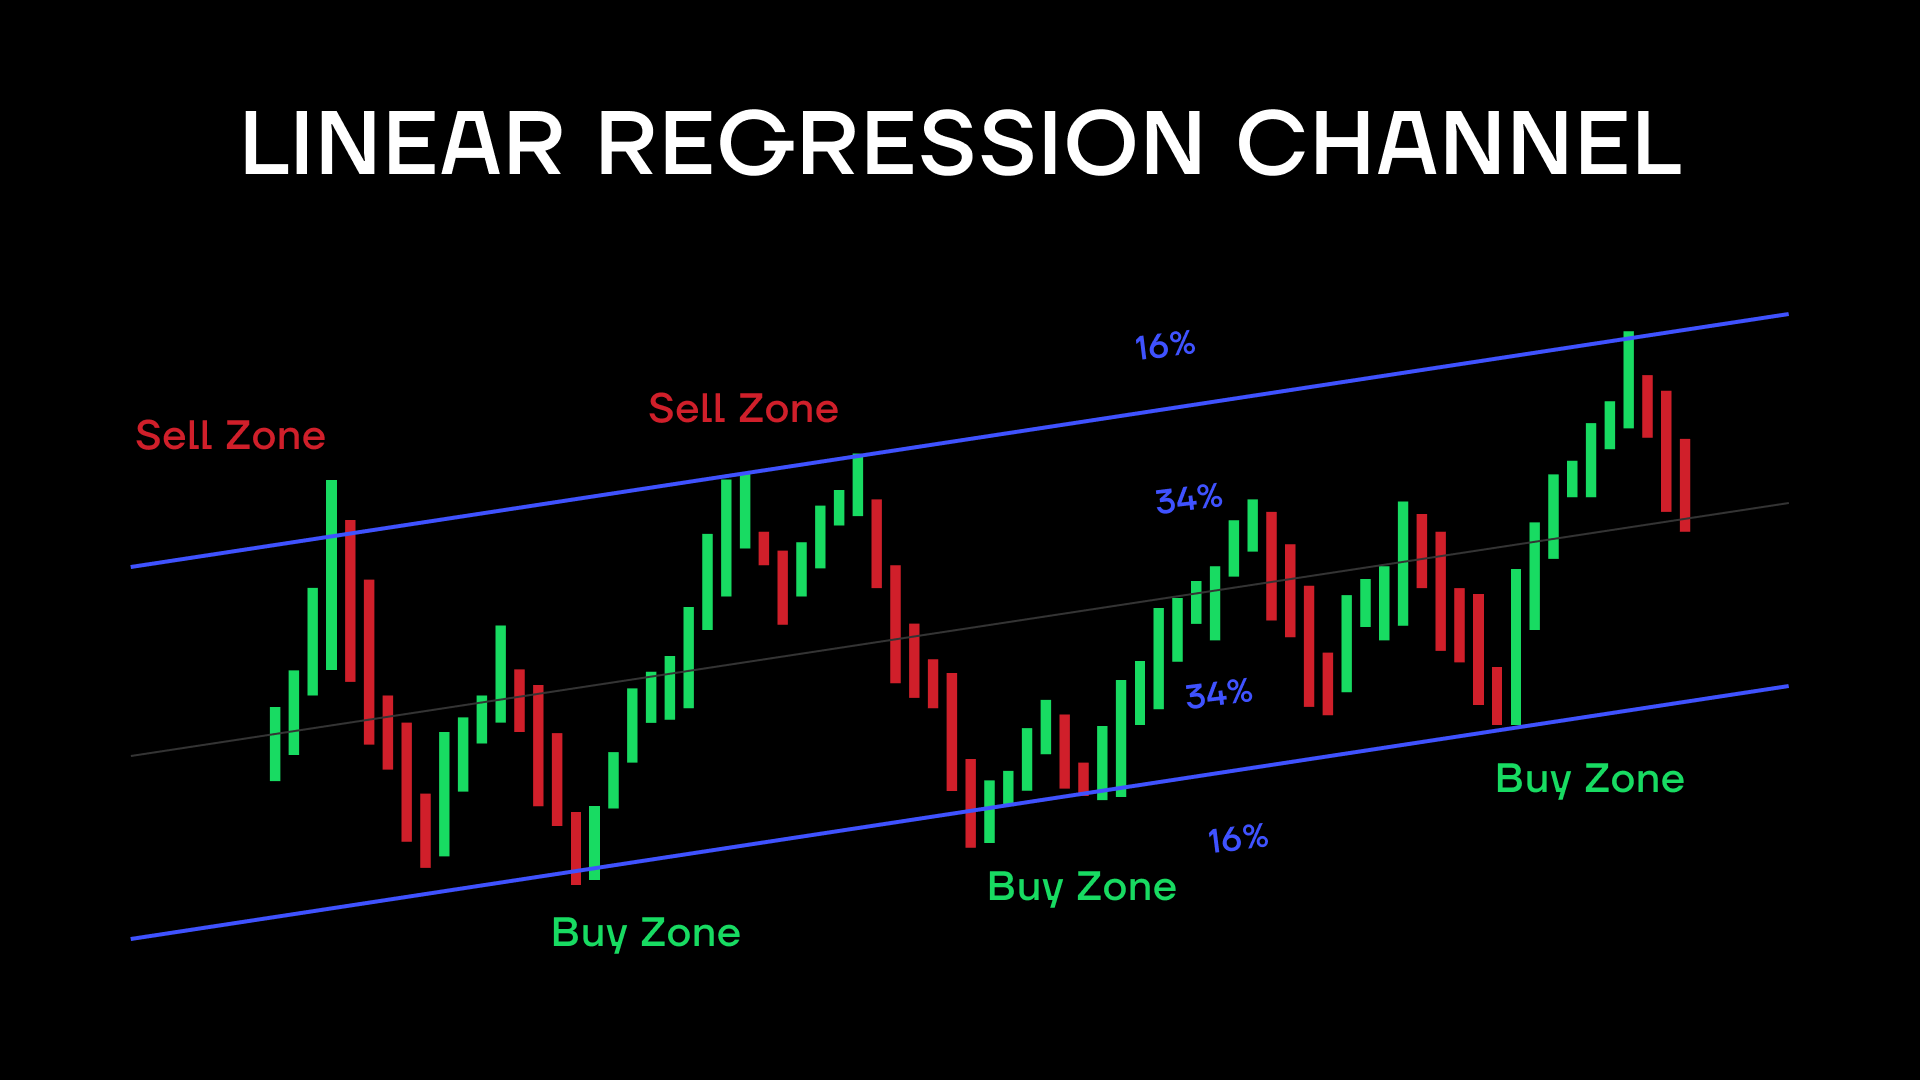
Linear regression channel
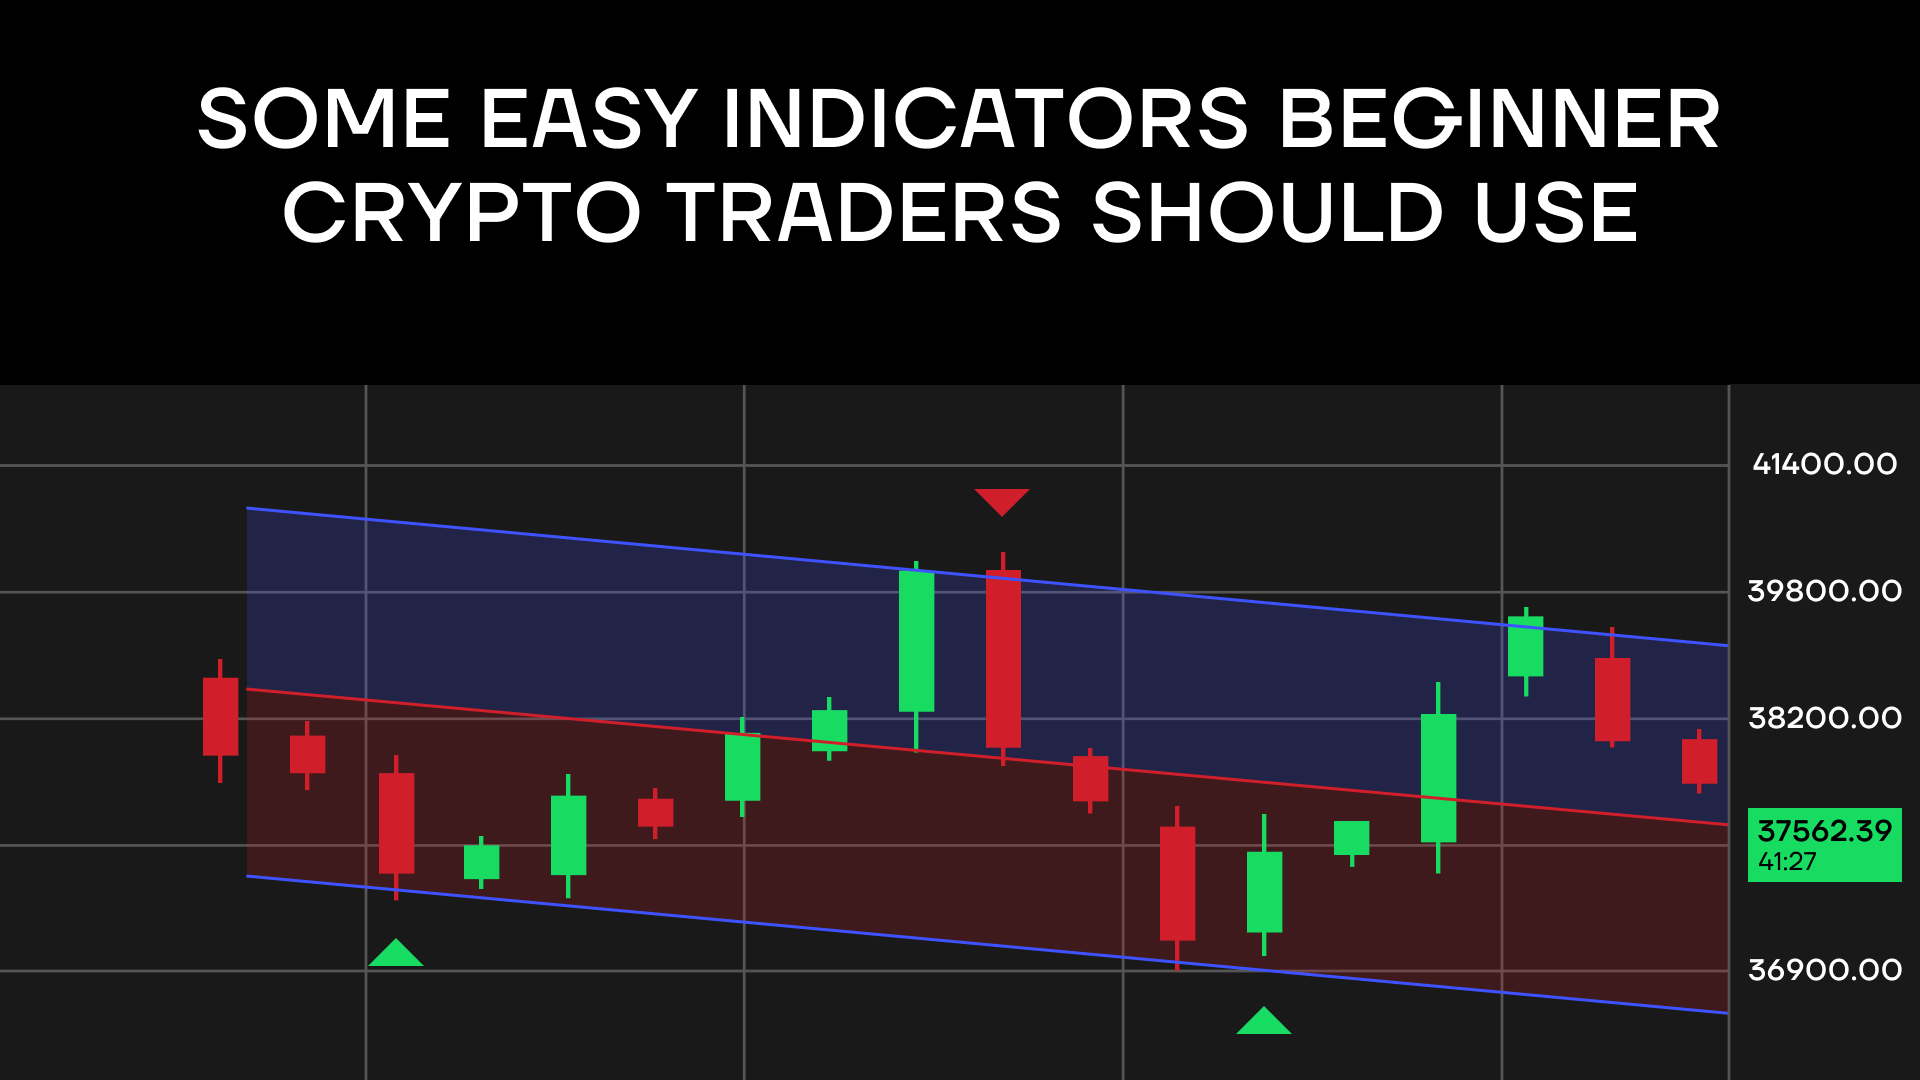
According to Forexpedia: “The Linear Regression Channel is a three-line technical indicator used to analyze the upper and lower limits of an existing trend.” This is a useful tool for many reasons, such as to see if a price trend is overextended, where to put stop loss and take profit limit orders, note possible trend change point, and more. This makes it possibly the best indicator for cryptocurrency trading too, among best bitcoin indicators or altcoin ones.
Technically speaking, it uses past price data to try to predict the future. (Best crypto indicators use the same logic.) The channel consists of the upper limit line, the lower limit line, and the regression line running in the middle of the two.
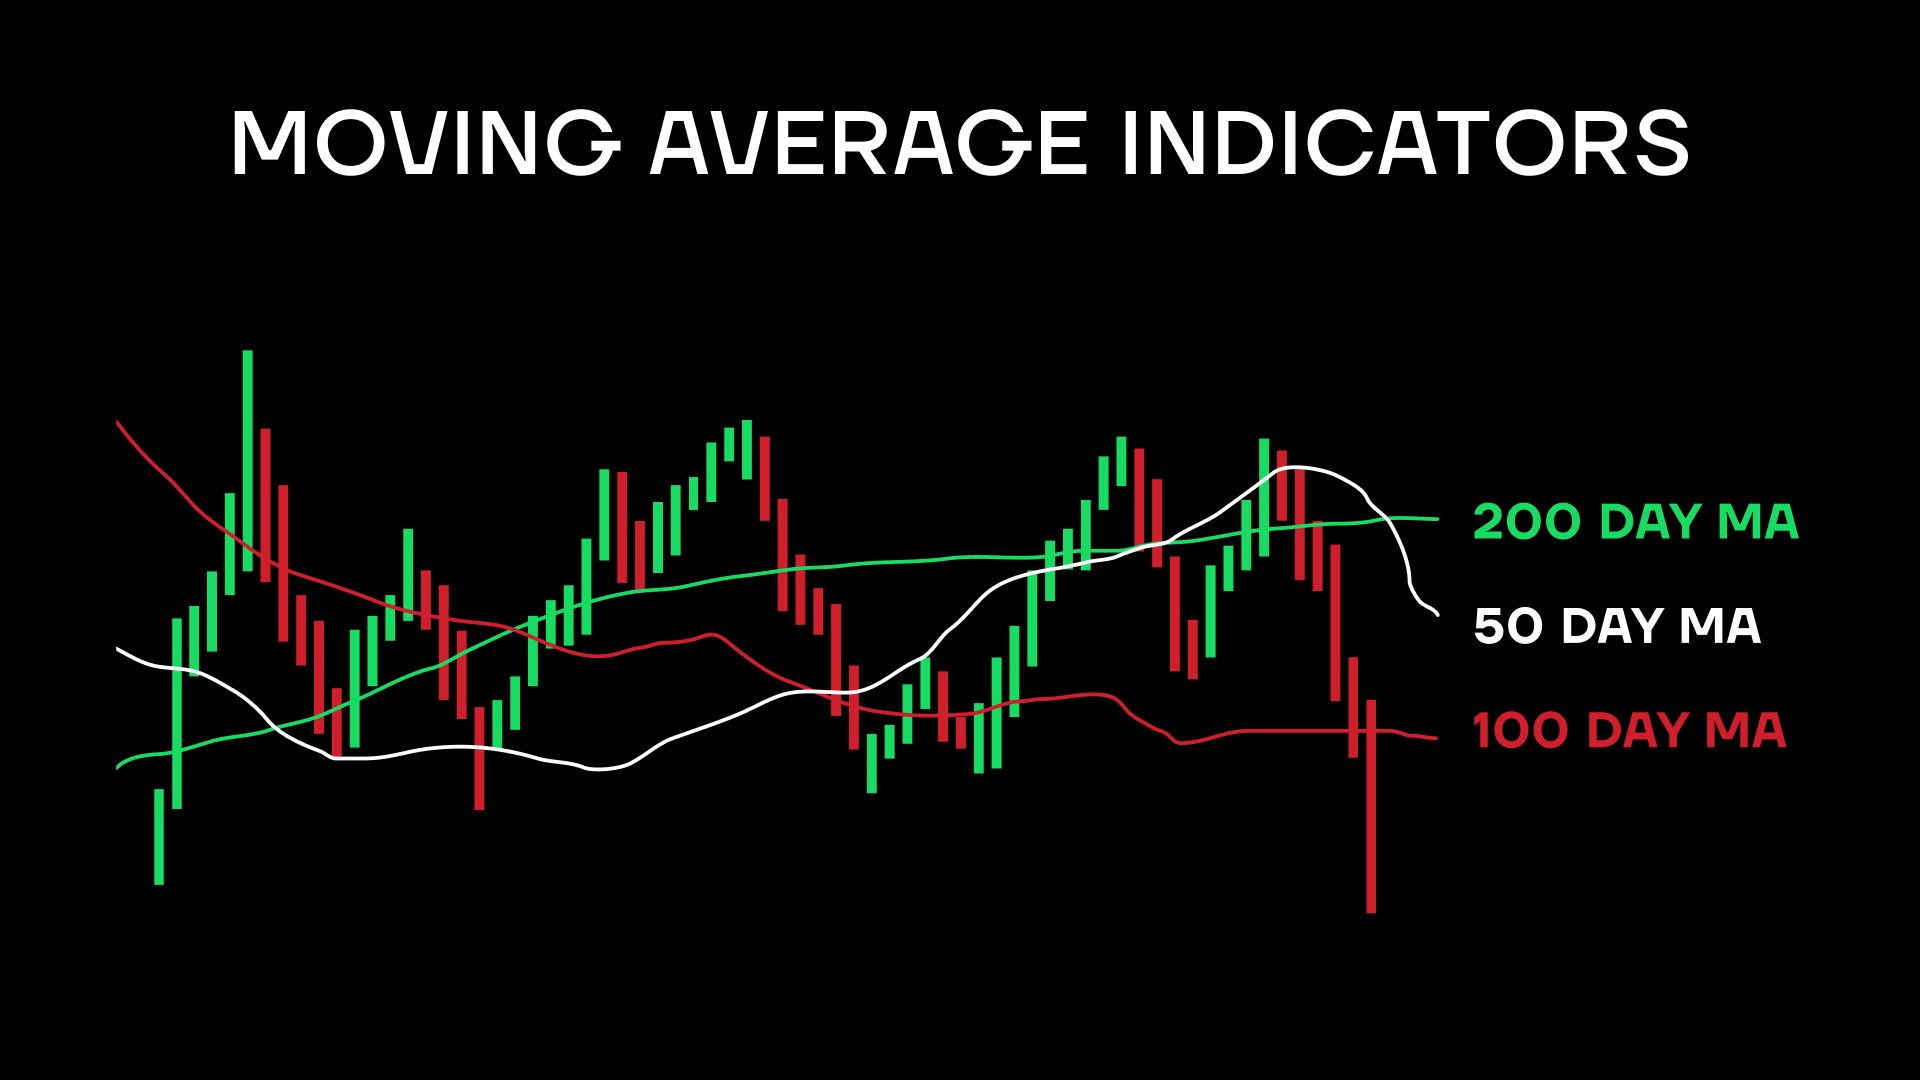
Moving average indicators
Let’s dive deeper into simple moving average indicators (SMAs), which are obviously among the best indicators crypto trading has. Typically, the main difference is in how many days an indicator looks at.
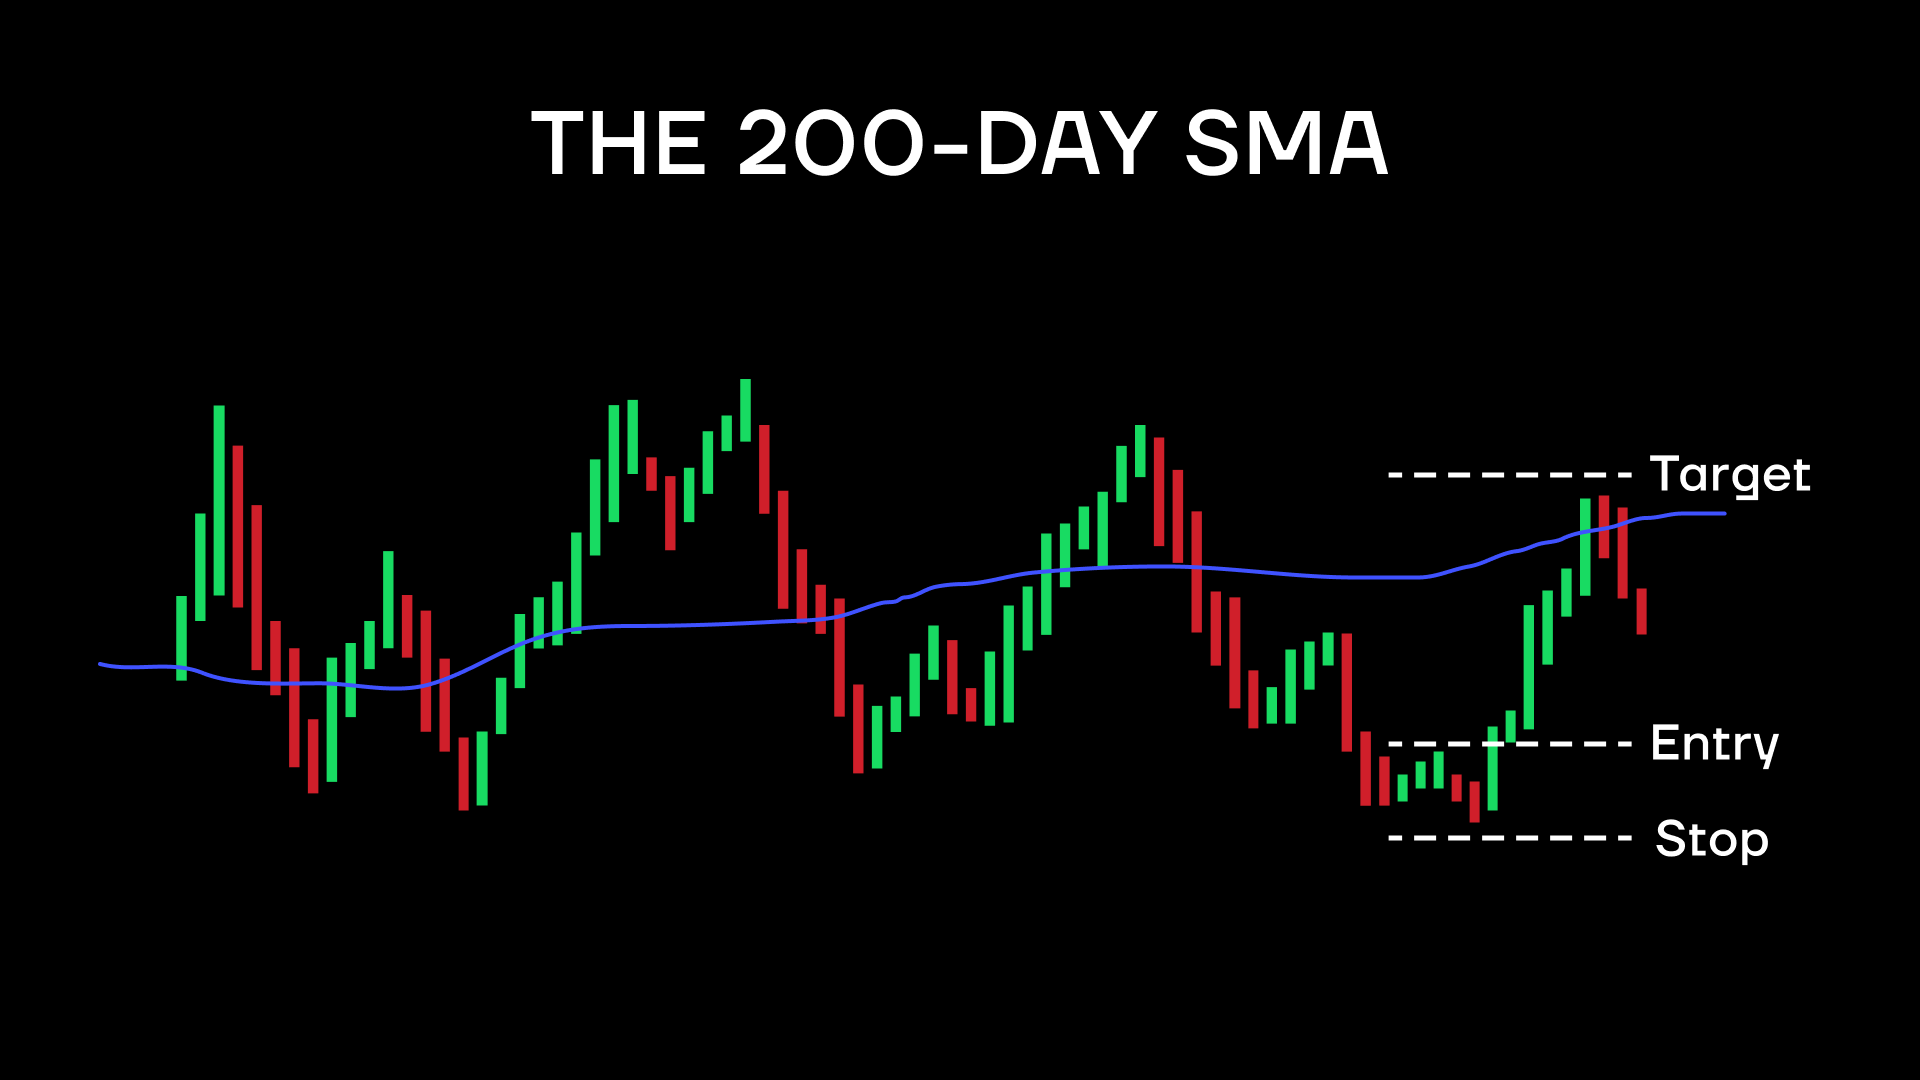
The 200-day SMA
One of the longer SMA ranges, the 200-day indicator gives traders enough time to analyze slower price movements. Over 200 days, market conditions could change, several quarters of company earnings pass, and a longer-term trend is more likely to form.
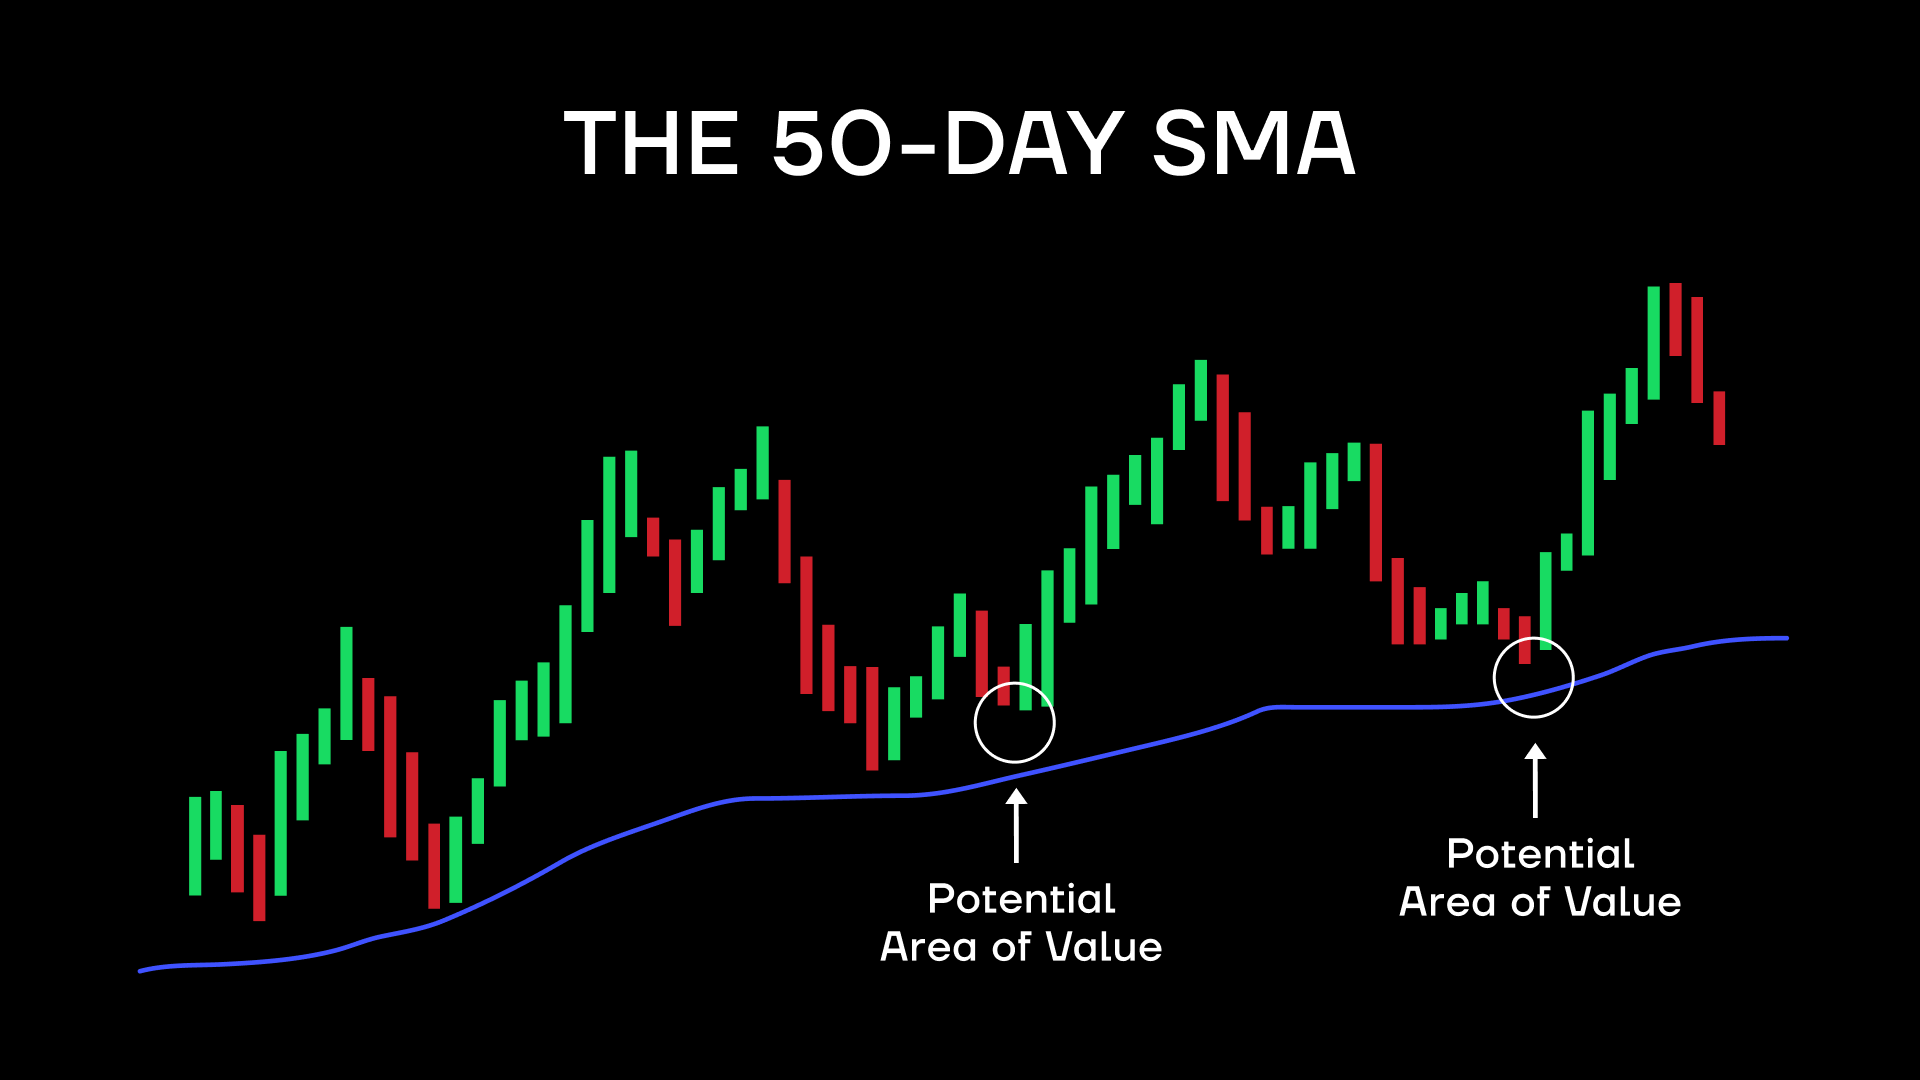
The 50-day SMA
Contrasting the 50-day SMA with the 200-day one can show if more recent price movement is diverging from the longer-term trend. Is the trend reversing? Is a new trend about to form? Many traders love to keep an eye on the point where the 200 and 50 day SMAs cross, for example, as a point of possible trend reversal. Again, the best indicators for cryptocurrency combine with each other for more insight.
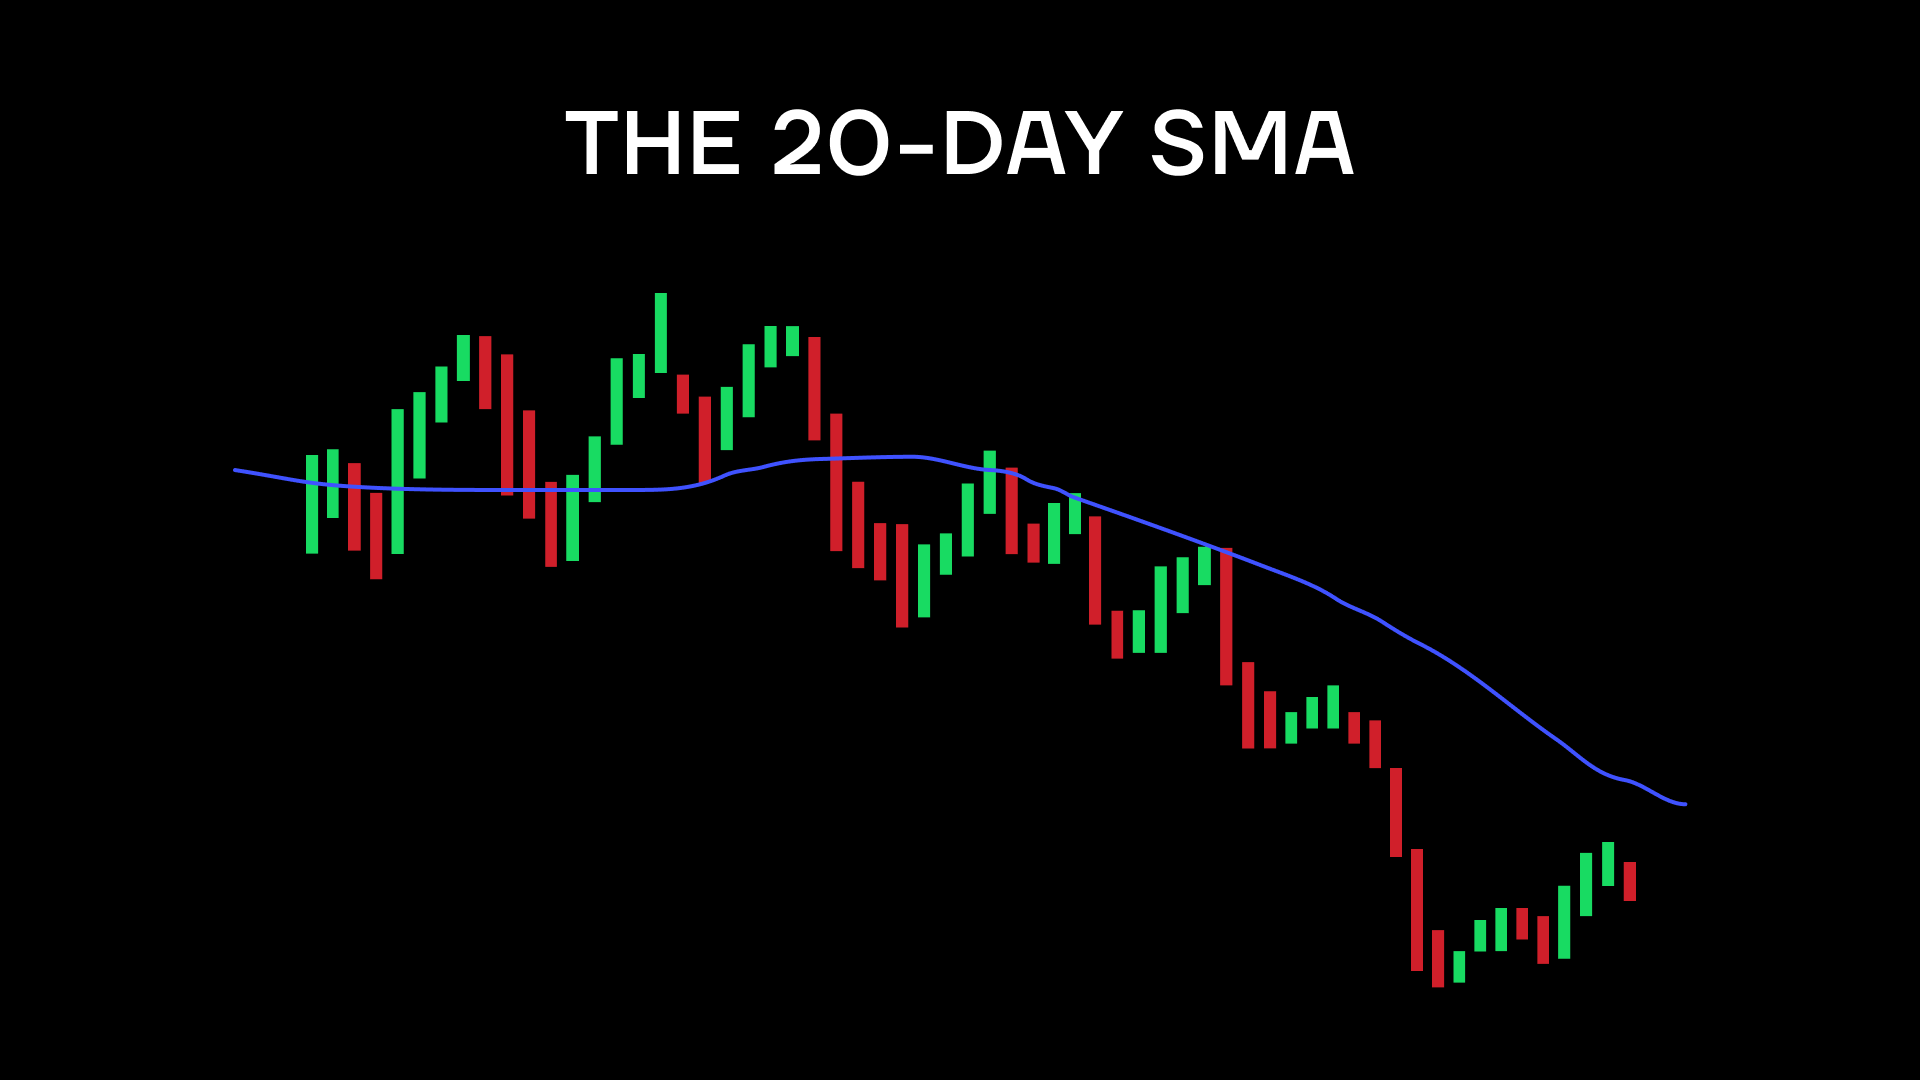
The 20-day SMA
Being even shorter of a time period, the 20-day SMA can show even more recent or more short term price trends. Some assets move faster than others, so it’s important to experiment and find the SMAs that make the most sense for a specific asset in a specific market. For example, the 20-day SMA is so short as to be among the best indicators for crypto trading, which itself is quite quick.
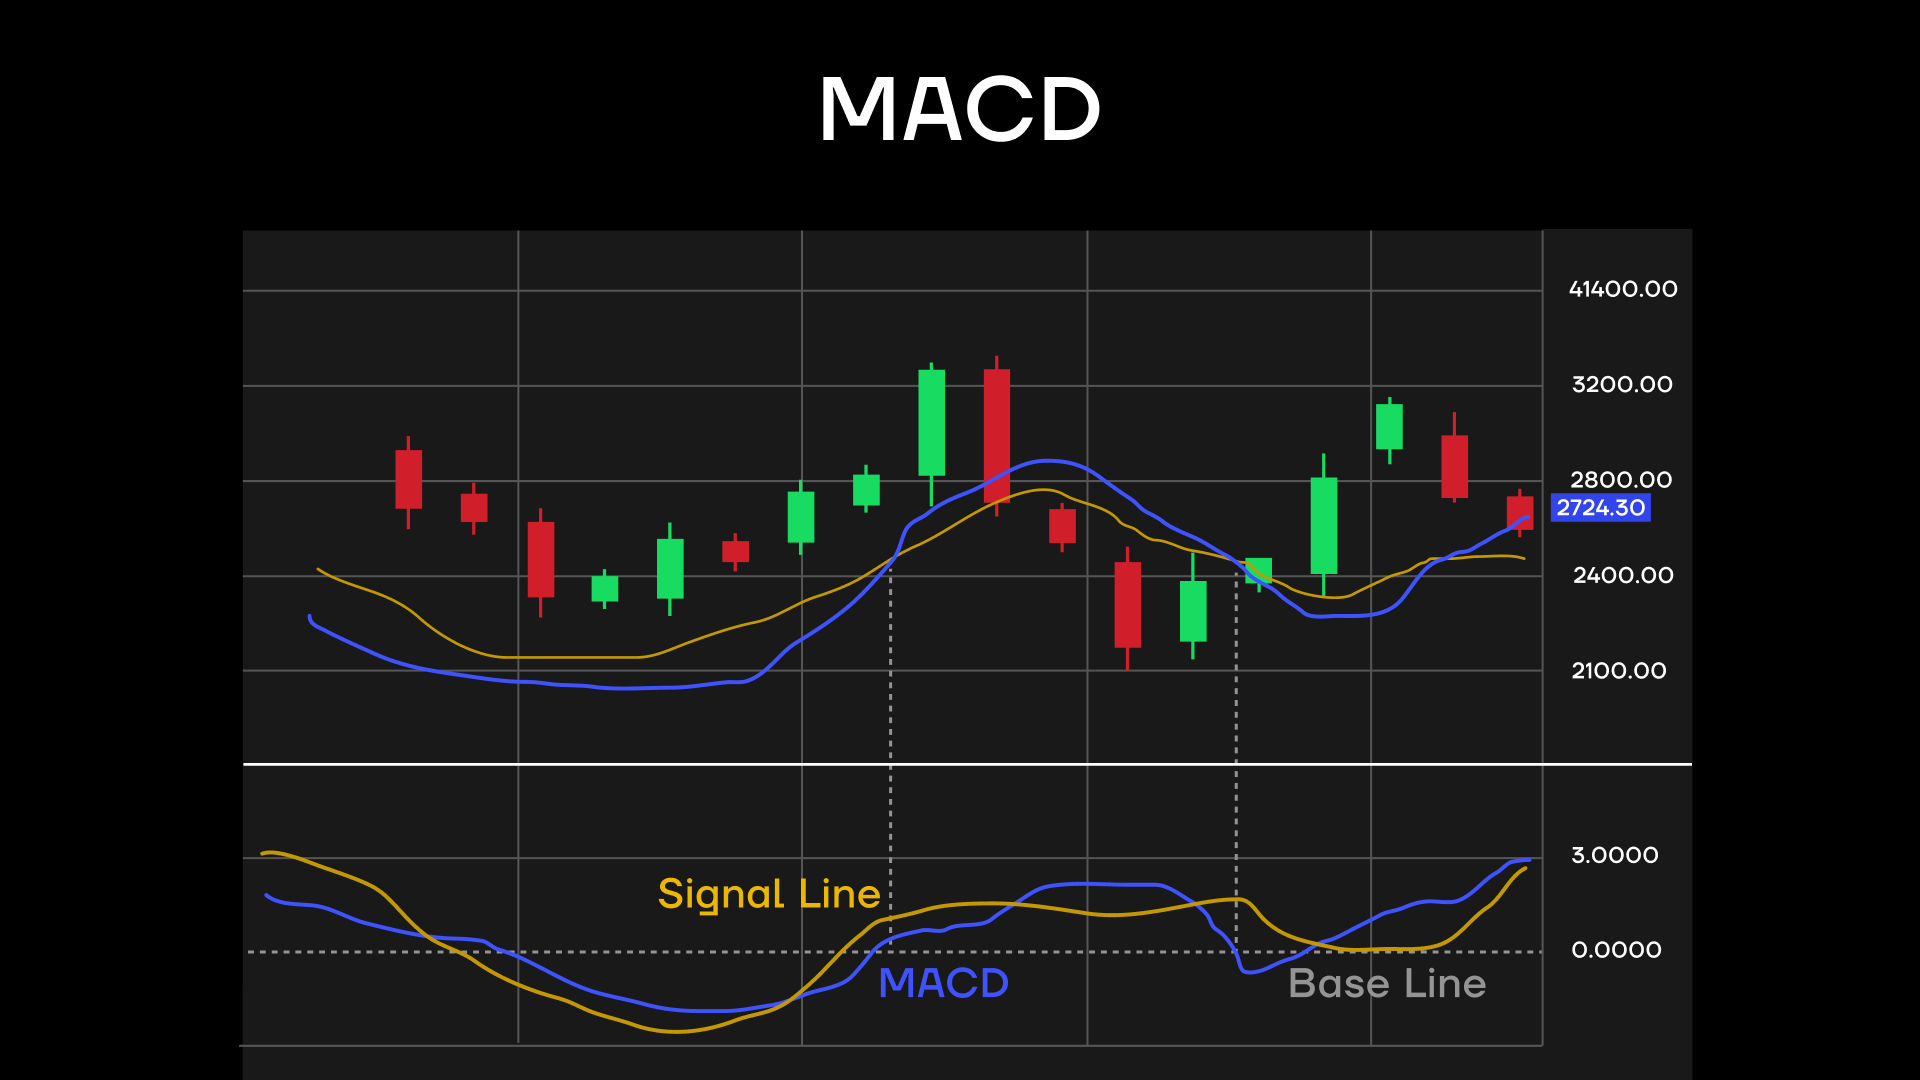
MACD
MACD stands for Moving average convergence divergence, and it is also used as one of trading indicators for crypto. It’s an easy way to see if the moving averages discussed above (and others) show different price trends, which could be an indication of a trend reversal or other changes in the market. It’s a popular tool for gauging momentum: if the moving averages are converging (aka coming together), it’s a sign of decreasing momentum (and vice versa).
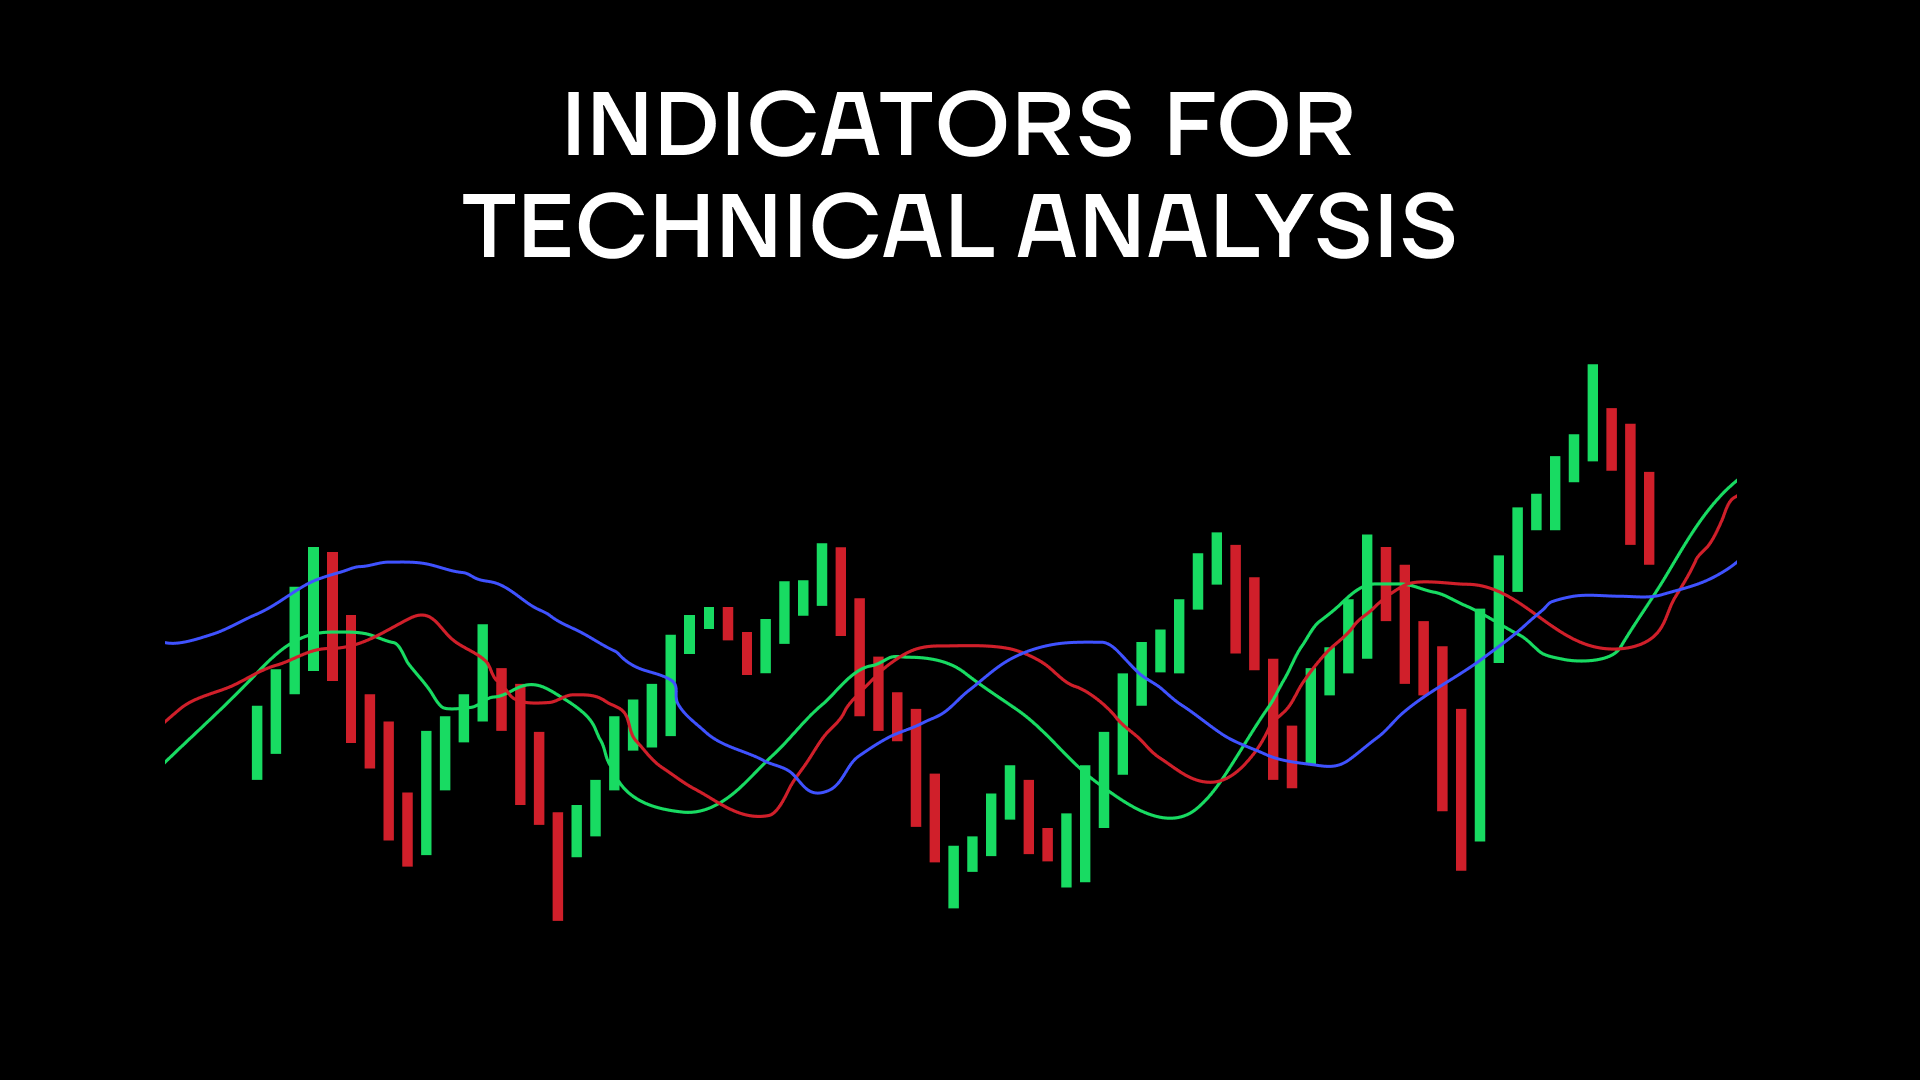
Indicators for Technical Analysis
Once you’ve had enough practice with basic indicators that are easy to understand just by looking at them, it’s time to look into more technical ones, maybe even starting to do deeper technical analysis. Yet, the best technical indicators for crypto day trading are not as scary once you get used to them.
RSI
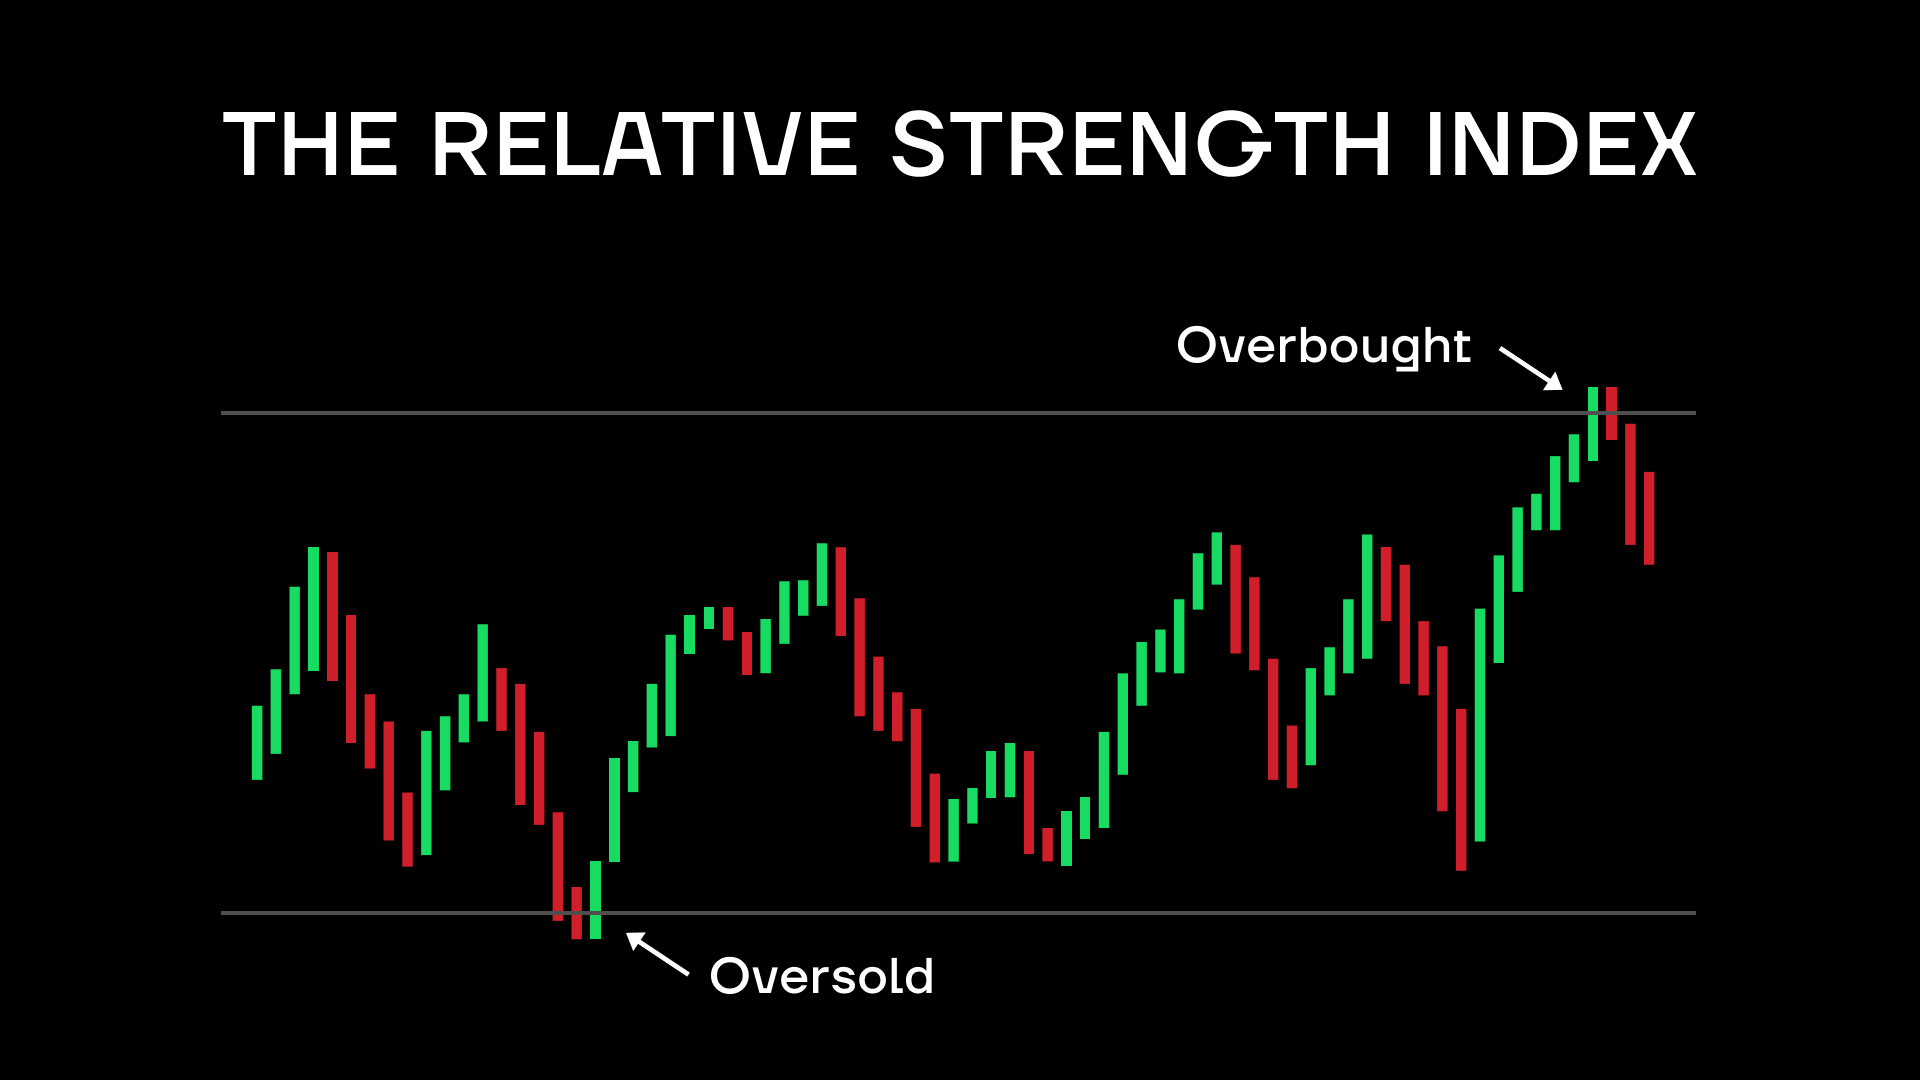
The Relative Strength Index (RSI) is a very popular indicator for identifying momentum and evaluating market conditions, regularly found among tradingview best indicators for crypto day trading. Best indicator crypto trading individuals use daily. It also serves up warning signals for dangerous price movements. It’s a scale from 0 to 100, with a score of over 70 considered overbought and under 30 seen as oversold. You can consider it similar to the fear and greed index in that overbuying is a sign of greed and overselling of fear in terms of where the traders see the price trend going. A common play is to use the RSI to short the asset when it’s overbought and long it when oversold.
Bollinger Bands
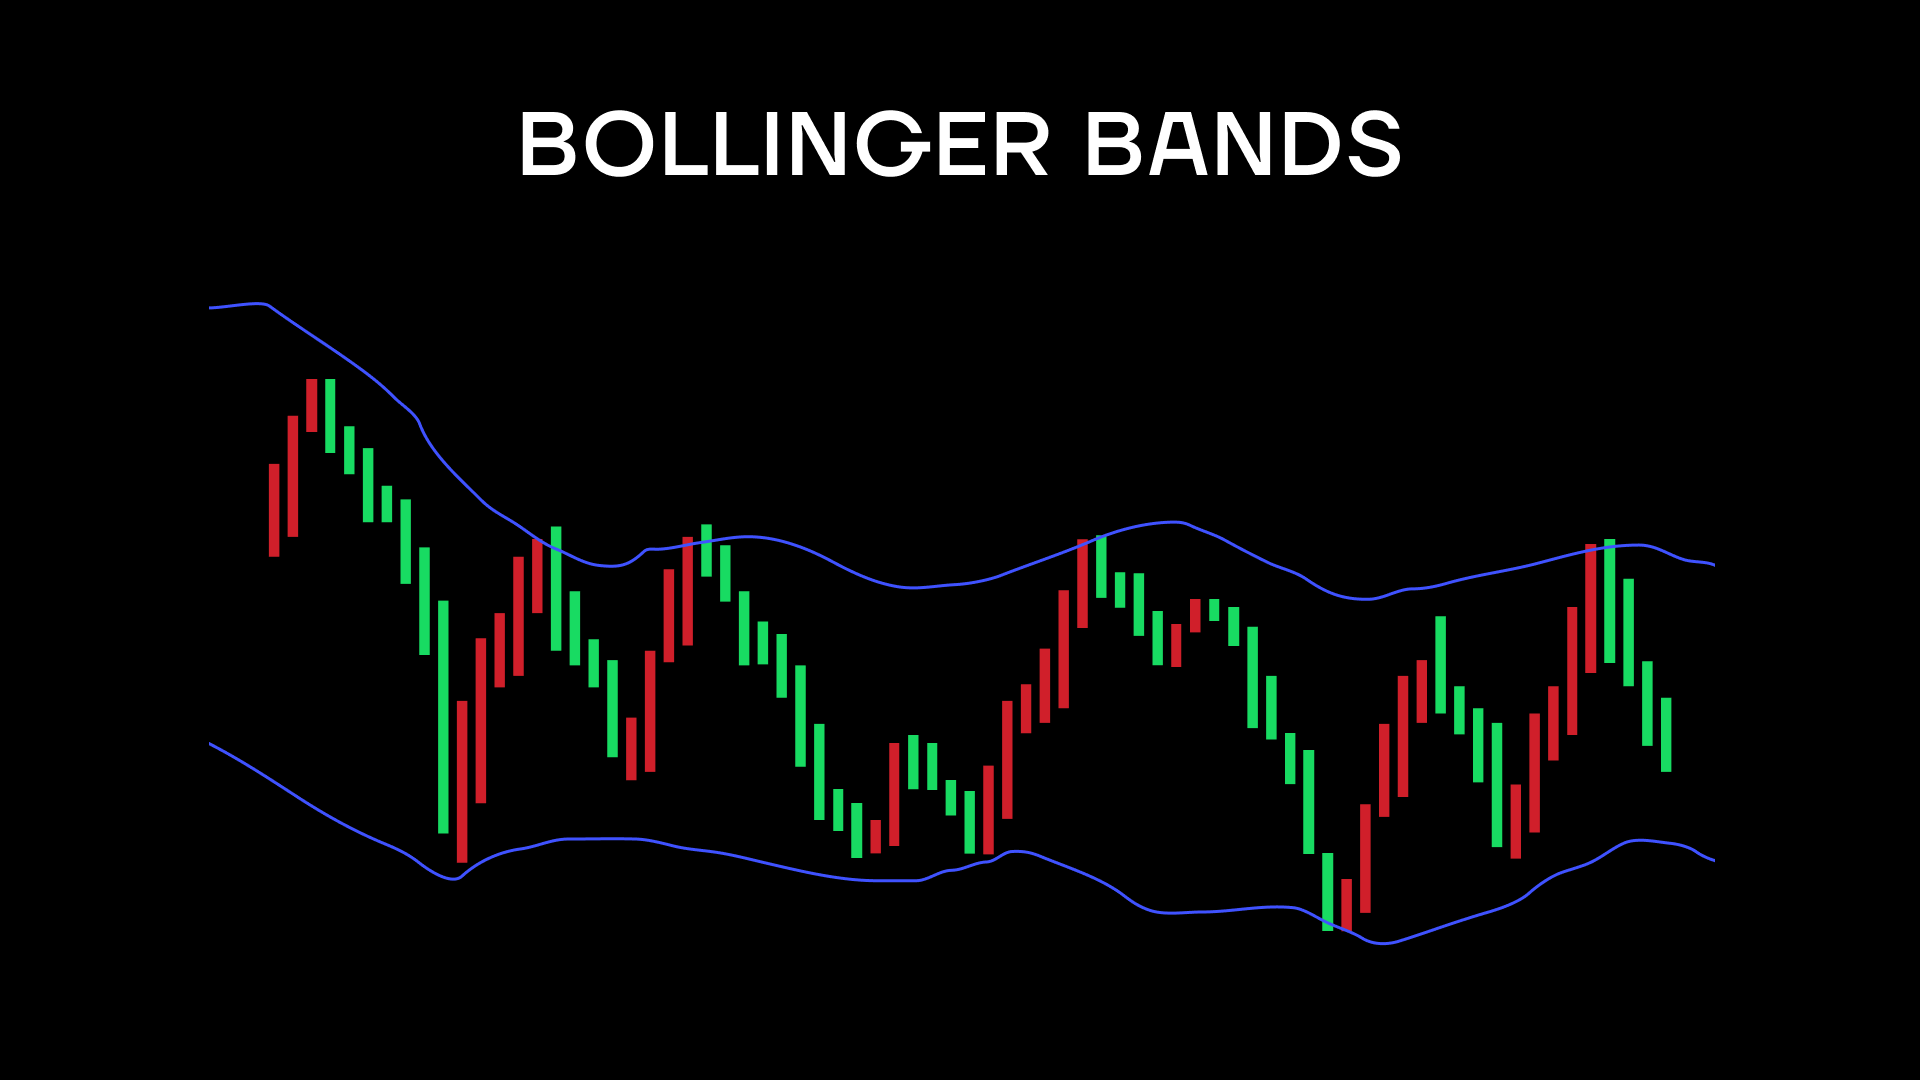
How do you know if an asset is trading within its typical price range? By looking at the bollinger bands, of course! If the bands are close to each other, the asset is perceived to have low volatility and vice versa. When the price keeps popping above the band, it’s considered overbought (and oversold if below). As such, bollinger bands can be used as a crypto volatility indicator alongside RSI to gauge if recent price movements are too far out of the asset’s usual behavior. Bollinger bands are generally used for longer-term price movement analysis.
Ichimoku Cloud
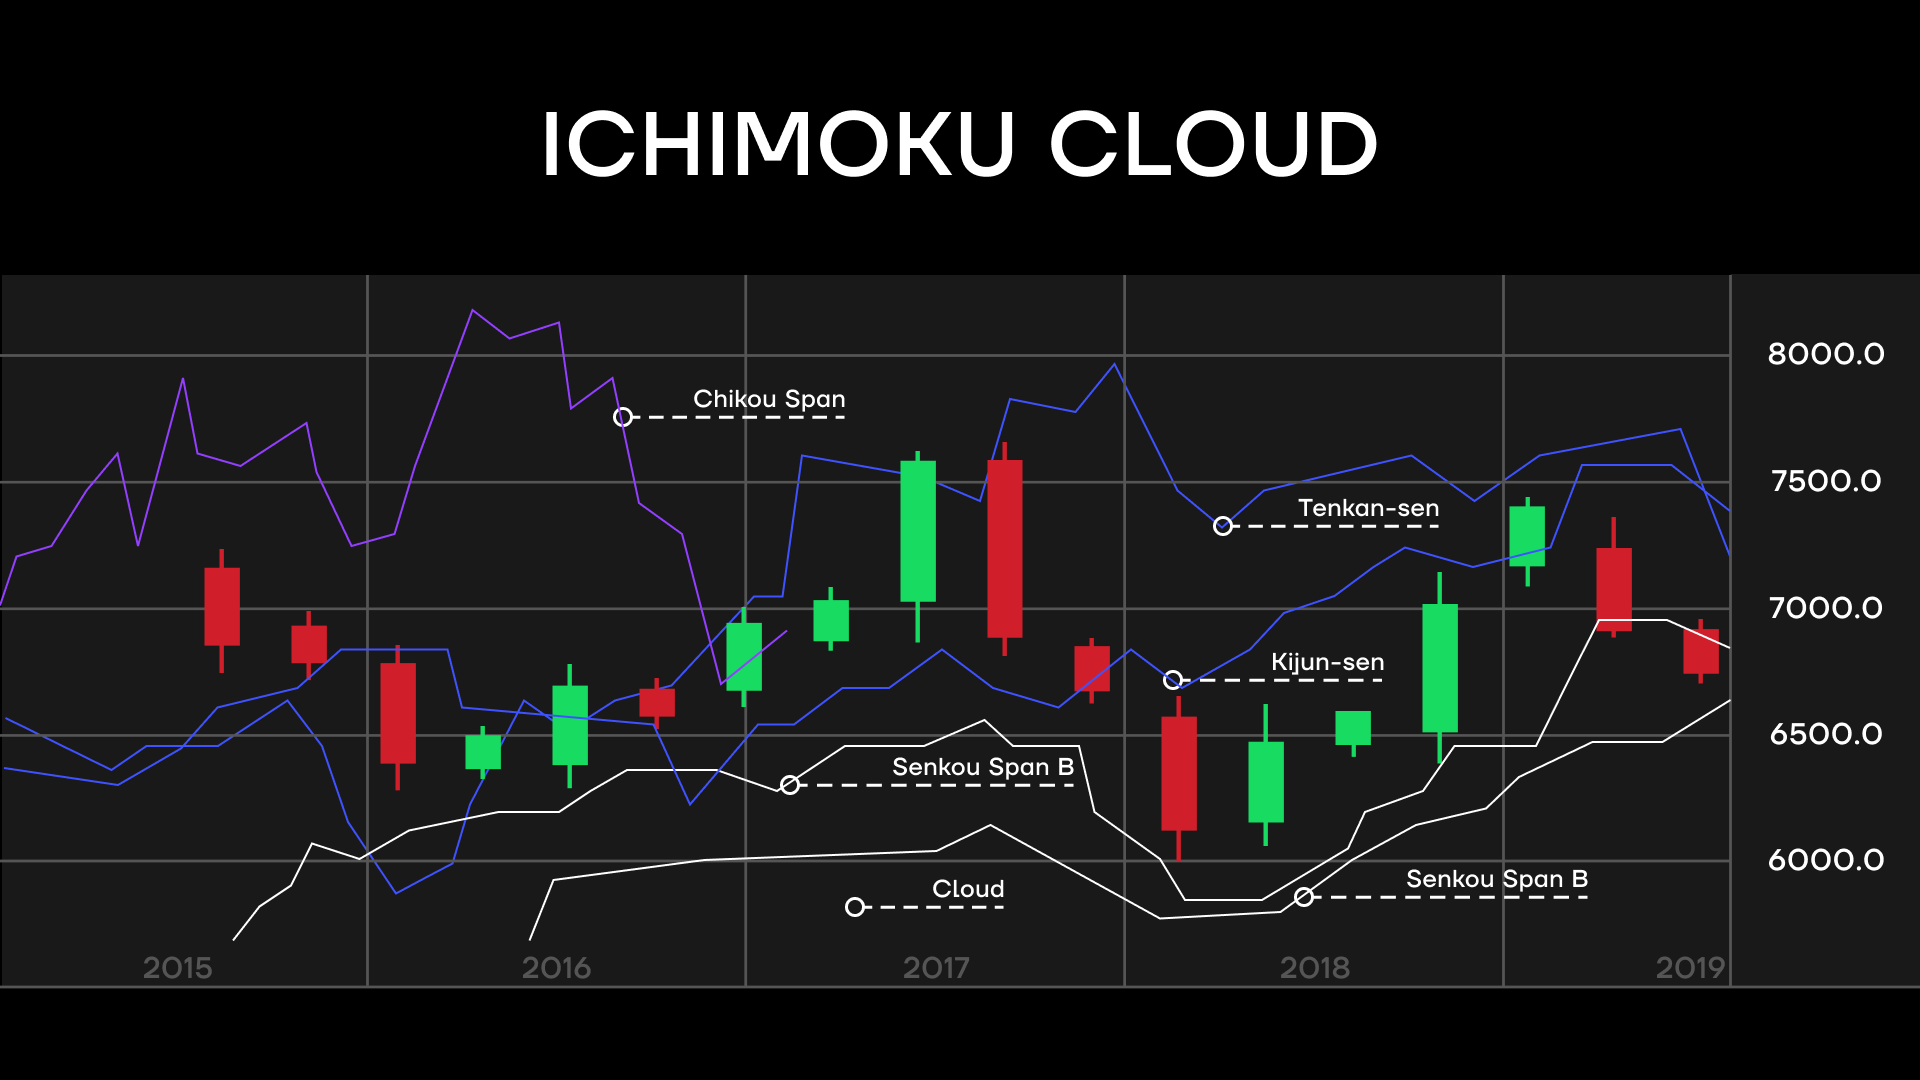
The main appeal of the Ichimoku Cloud indicator is to show as much information as possible in one chart. Like many other indicators, it tries to predict future trends by showing support and resistance levels. Try it as one of your crypto buy sell indicator or general cryptocurrency indicators.
OBV
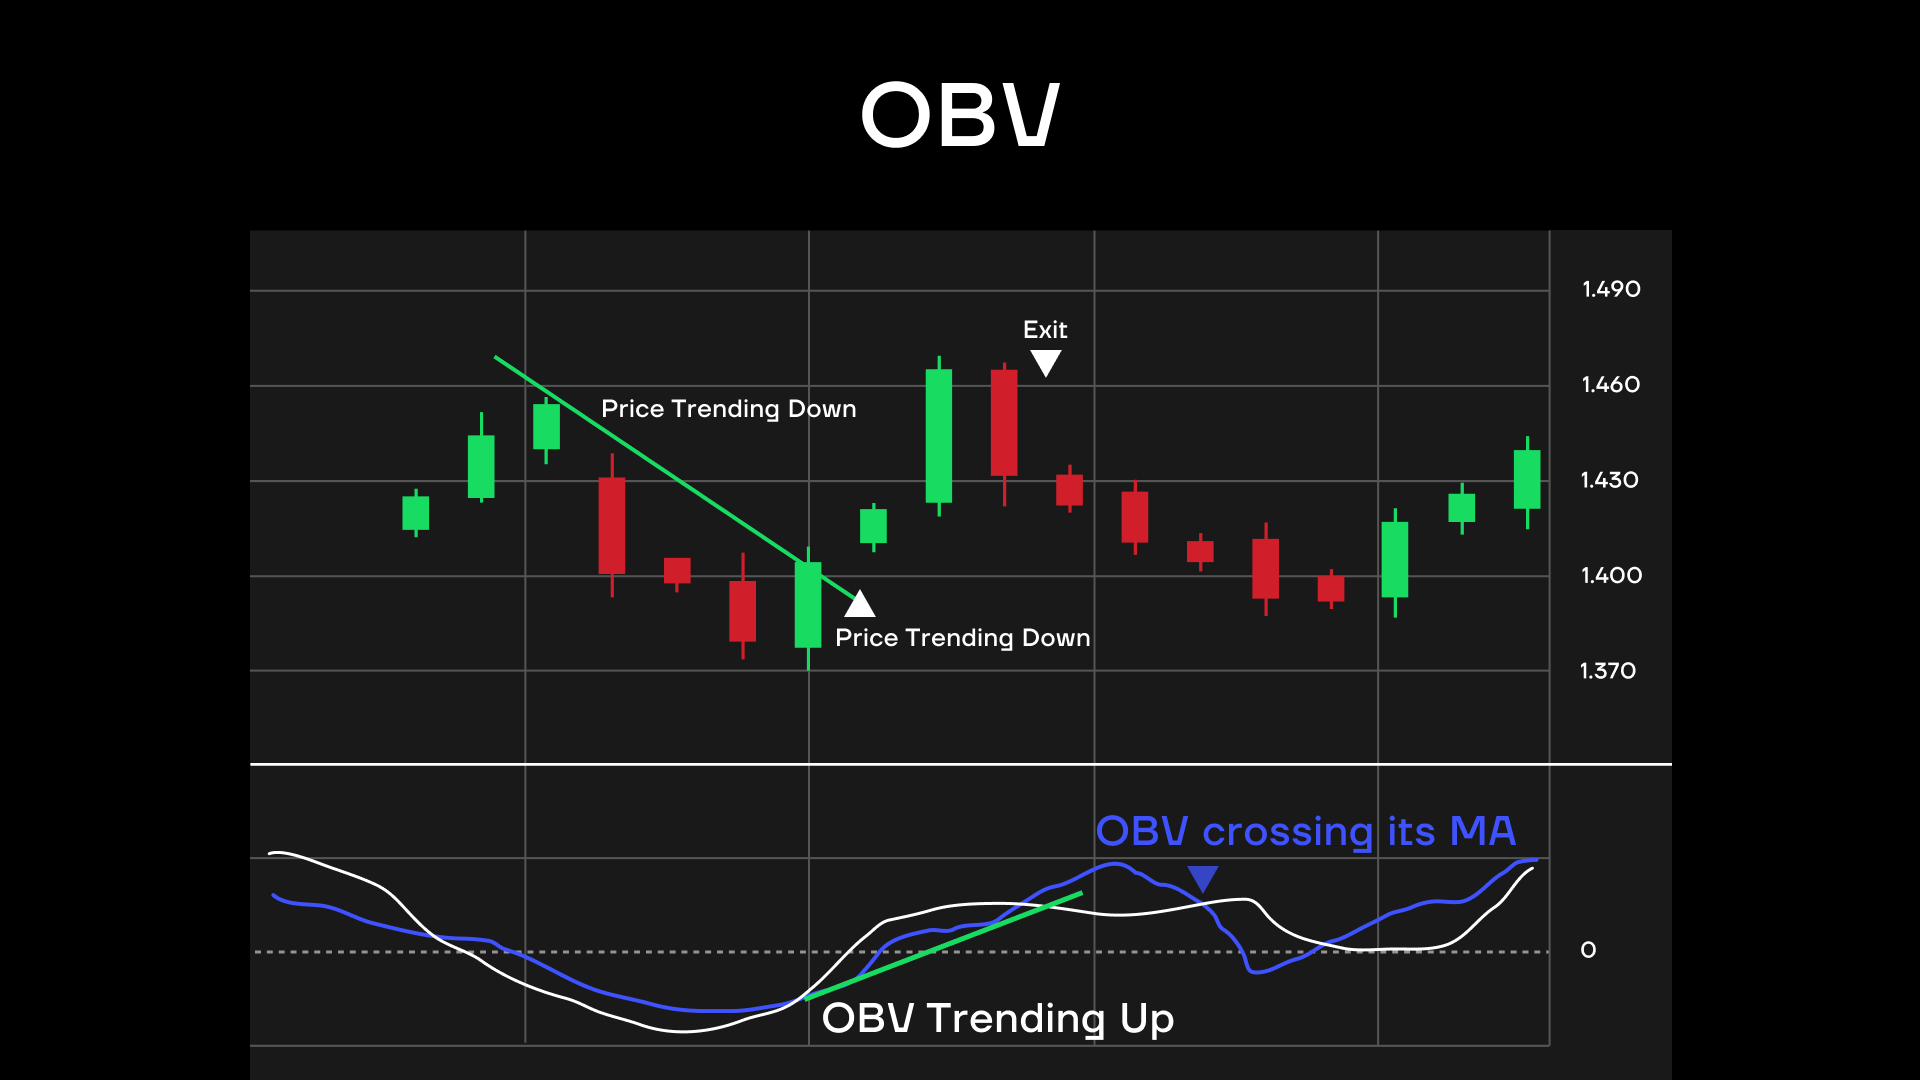
Price movement can be deceiving for a number of reasons, even if based on the best indicator for crypto trading. One of them is if the trading volume is low, it’s too easy for a few trades to momentarily move the price without it accurately reflecting the market. That’s why the On-balance volume (OBV) indicator is such a good tool since it uses volume flow as a predictor of price movement. Developed back in 1963, it is still a key part of most indicator toolkits, even being used among trading crypto indicators.
MYC Trading Indicator
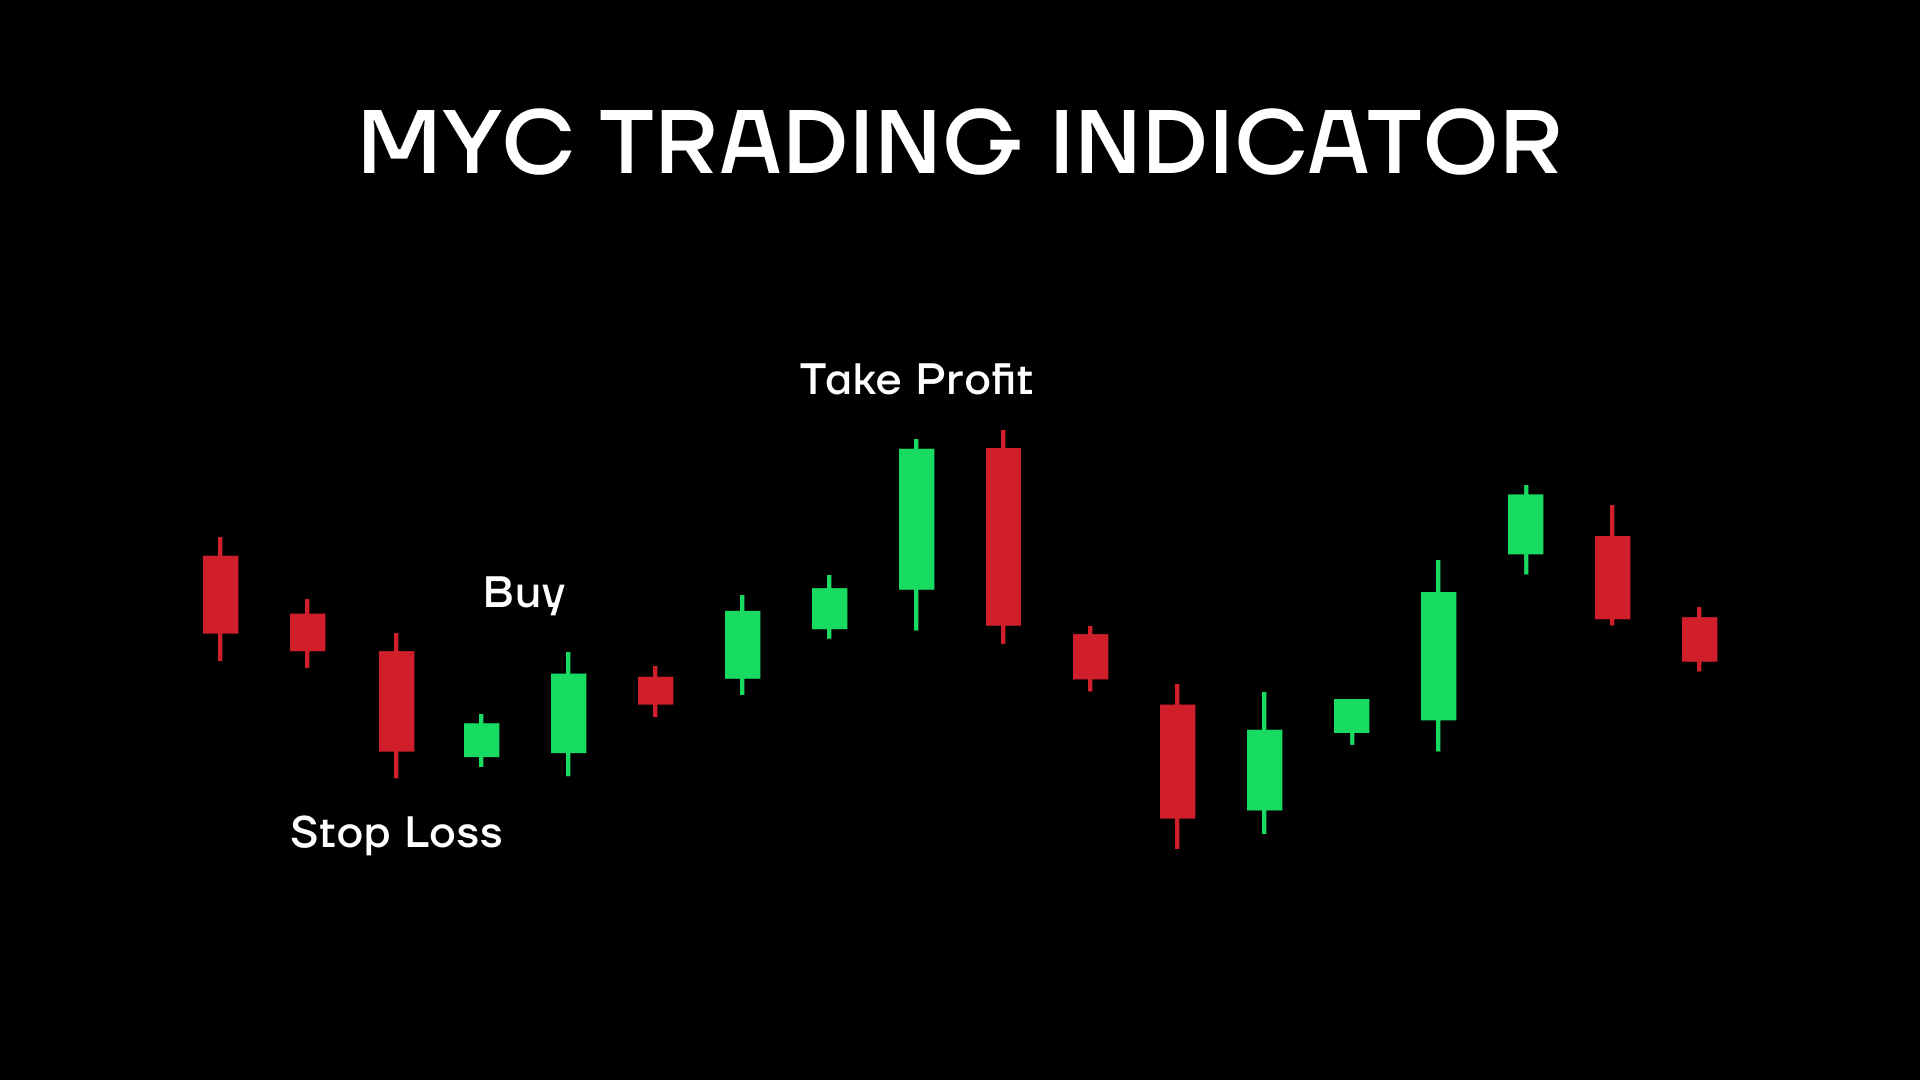
Is the best indicator for crypto a more complex one? Certainly, MYC is one of the more complex if also the best indicators for crypto. This more advanced indicator combines trend analysis with momentum oscillators with the goal of trying to determine whether an asset will go into bullish or bearish territory. MYC’s trendline is supposed to predict whether a bullish or bearish signal will be produced. As such, it is one of the more forward-looking indicators and is meant to give its users an idea of the upcoming signals before they are even formed.
Fibonacci retracement
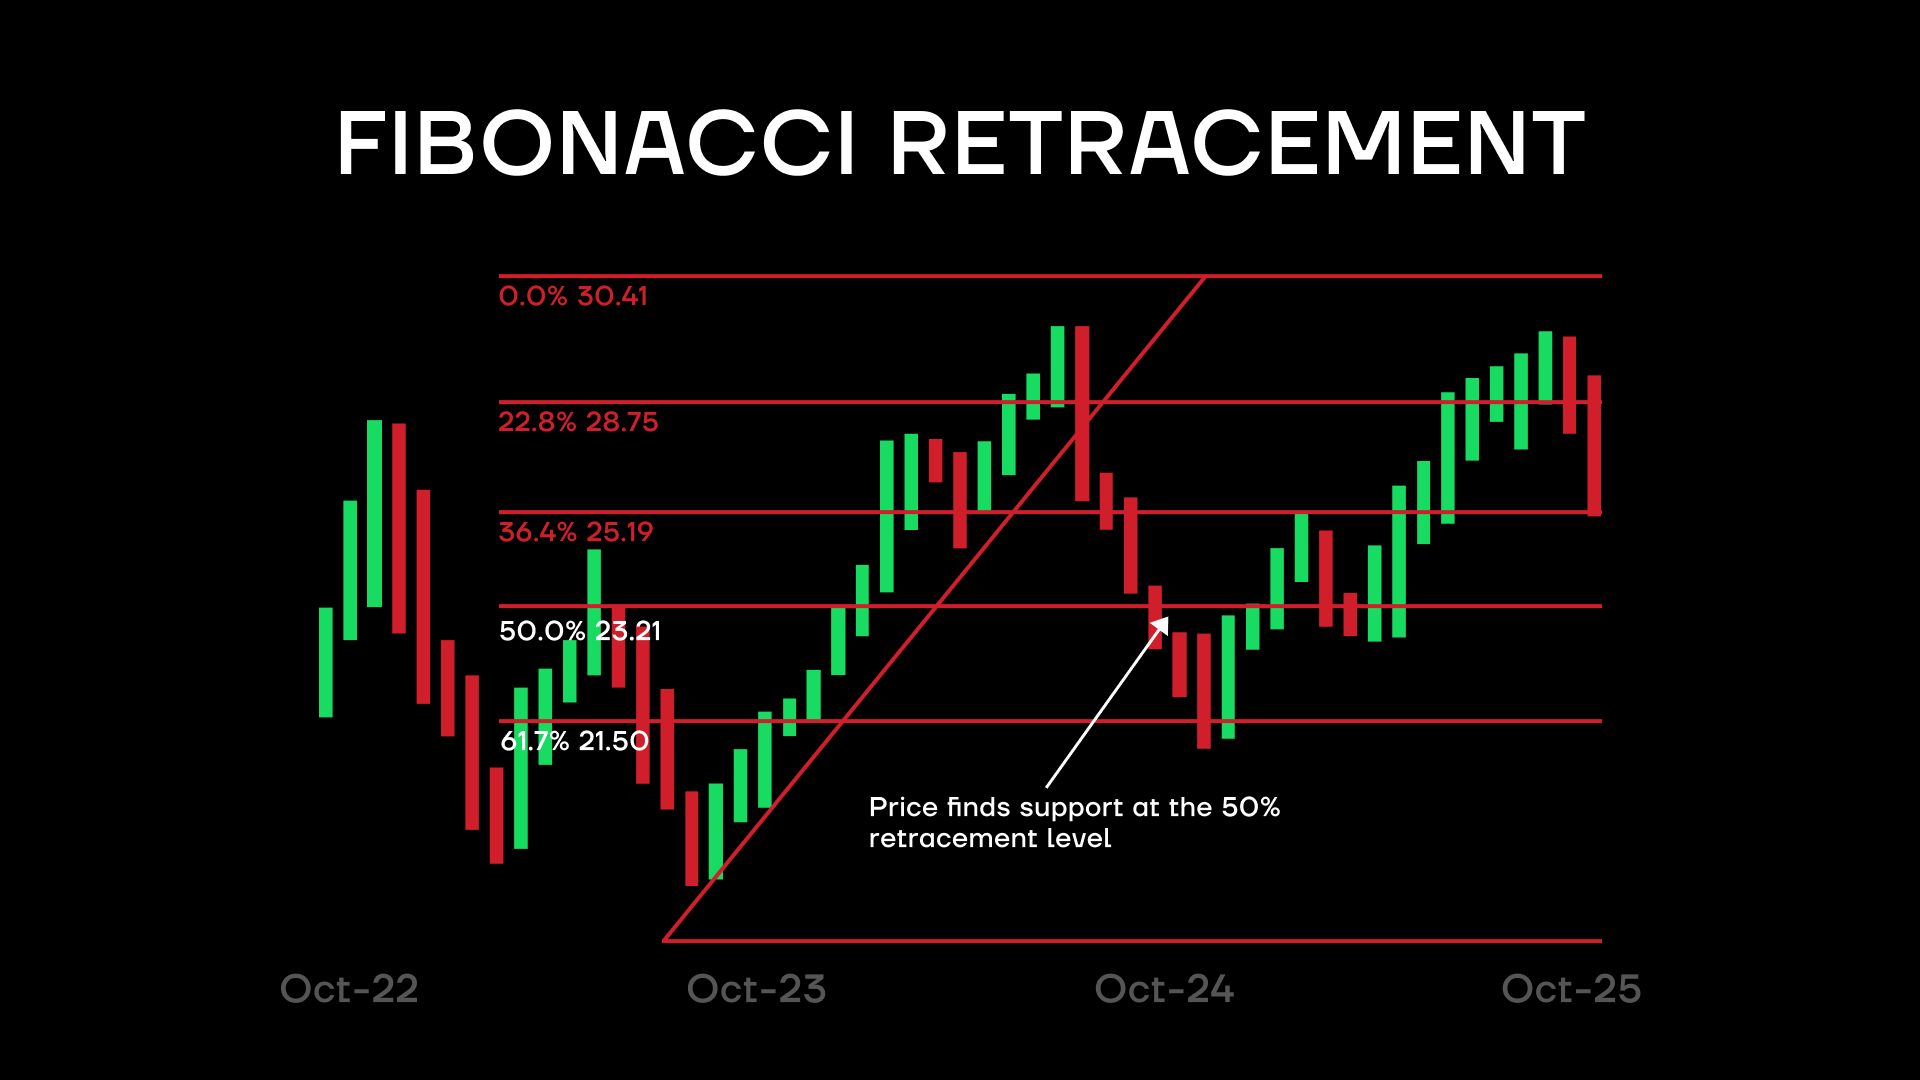
Math nerds know well the almost magical presence of the Fibonacci pattern in nature. And it finds its place in trading as well, with Fibonacci retracement usually used to confirm whether an overbought/oversold market is about to make a retracement back to its usual price trend, usually in the form of a temporary dip from an upward trend. This makes Fibonacci retracement a convenient tool for determining where to set limit orders. (And why shouldn’t the best indicator for crypto trading have that Fibonacci magic?)
These are just some of hundreds, if not thousands, of indicators used by traders daily. Mastering these will open up the path to many others and to a more nuanced, more technical analysis-based approach to trading. And when crypto trading best indicators are the ones that help you set better orders and get better results.
